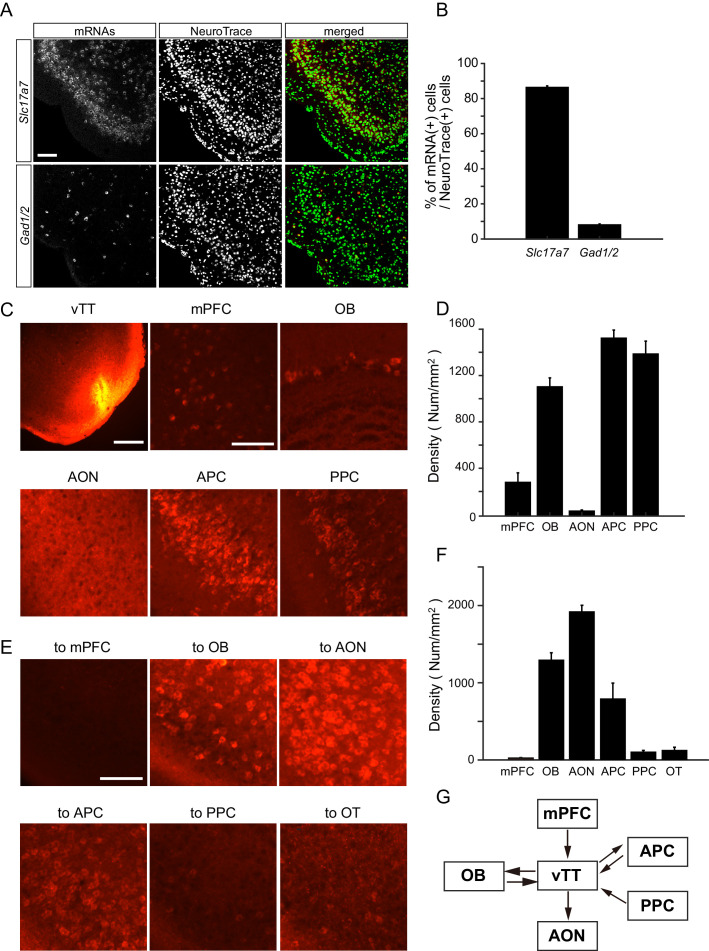
Figure 6. Cell types and connectivity patterns of vTT cells.
(A) In situ hybridization of Slc17a7 (upper panels) and Gad1/2 (lower panels) mRNAs with Neurotrace staining of vTT cells. Scale bar, 100 μm. (B) Average percentages of Slc17a7-positive cells (left column) and Gad1/2-positive cells (right column) among Neurotrace-positive cells in the vTT (n = 3 mice). Error bars indicate SEM. (C) Upper left: Coronal section of the vTT after injection of Alexa 555-conjugated cholera toxin subunit B (CTB, red). Scale bar, 500 μm. The five other panels show CTB-labeled cells after CTB injections in the vTT. mPFC, medial prefrontal cortex; OB, olfactory bulb; AON, anterior olfactory nucleus; APC, anterior piriform cortex; PPC, posterior piriform cortex. Scale bar, 100 μm. (D) Average density of CTB-labeled cell bodies in each area (mPFC, n = 5 from three mice; OB, n = 5 from three mice; AON, n = 3 from two mice; APC, n = 5 from three mice; PPC, n = 5 from three mice). Error bars indicate SEM. (E) CTB-labeled vTT cells after injection of CTB into the mPFC (upper left), OB (upper middle), AON (upper right), olfactory tubercle (OT, lower left), APC (lower middle), and PPC (lower right). Scale bar, 100 μm. (F) Average density of retrogradely labeled CTB-positive cells in the vTT (n = 3 from two mice). Error bars indicate SEM. (G) Schematic diagram of vTT connectivity patterns. Arrows indicate axonal projections.

