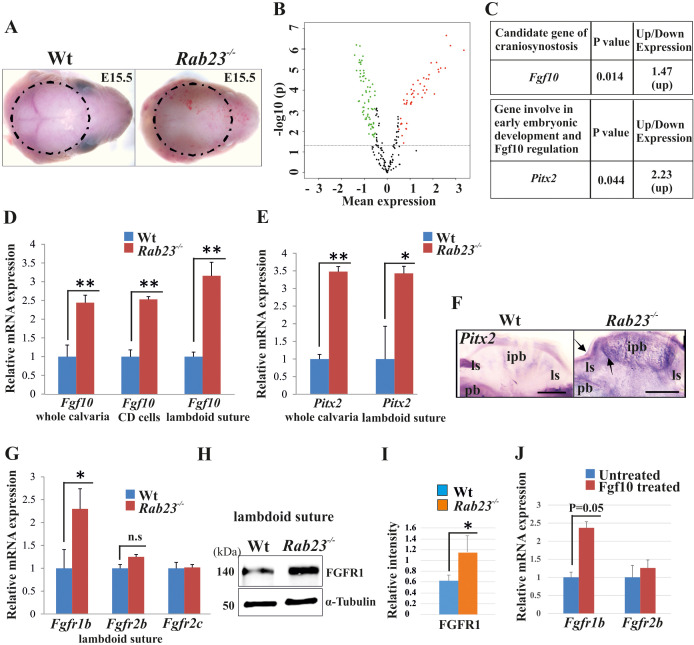
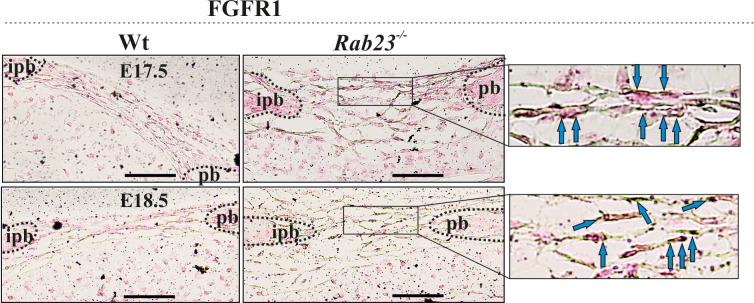
Figure 2. Gene expression analysis in Wt and Rab23-/- lambdoid suture.
(A) Wt and Rab23-/- calvaria at E15.5 (dotted ring, excluding skin) processed for Illumina based microarray (n = 3 for each age and genotype). (B) Analysis of mRNA based microarray data by Chipster, a bioinformatics tool, reveals that 223 genes are differentially expressed (t-test, p<0.05, 115 genes are upregulated, red and 108 genes are downregulated, green) in Rab23-/- calvaria, represented by volcano plot (n = 3 for each age and genotype). Fold change of genes is calculated by arithmetic mean in linear scale and shown in the volcano plot. Fold change >1 (up-regulated gene), fold change < 1 (down-regulated gene). The gene list is provided in Supplementary file 1. (C) Represents individual searches of genes based on their contribution of suture fusion reveals Fgf10 as a candidate gene and Pitx2 as another developmentally important gene that can regulate Fgf10 expression. Both genes are upregulated in Rab23-/- calvaria. (D, E) RT-qPCR analysis of Fgf10 (D) and Pitx2 (E) mRNA extracted from E15.5 Wt and Rab23-/- calvaria (excluding skin), cultured calvaria derived primary cells (CDC) and from lambdoid sutural tissue reveals that Fgf10 and Pitx2 are overexpressed in Rab23-/- samples (n = 3 calvaria and eight lambdoid sutures for each genotype). Gene expressions were normalized by 18S rRNA. Data are represented as mean ± SD, paired Student’s t-test was used and as relative gene expression is shown using ΔΔCт values. Statistical significance was defined as a p-value <0.05 (*), p-value <0.005 (**). (F) Pitx2 expression analysis by whole-mount ISH in Wt and Rab23-/- calvaria at E15.5. Arrows indicate Pitx2 overexpression in the lambdoid suture. pb: parietal bone, ipb: interparietal bone, ls: lambdoid suture. Scale bar: 500 µm. (G) RT-qPCR expression analysis of Fgfr1b, Fgfr2b and Fgfr2c mRNA from E15.5 Wt and Rab23-/- lambdoid suture reveals Fgfr1b overexpression in Rab23-/- sample (n = 8 for each genotype). Gene expressions were normalized by 18S rRNA. Data are represented as mean ± SD, paired Student’s t-test was used and relative gene expression is shown using ΔΔCт values. Statistical significance was defined as a P-value <0.05 (*). (H, I) Western blotting of proteins extracted from Wt and Rab23-/- lambdoid suture at E15.5 (H) and relative intensity measurement (I) reveals over expression of FGFR1 in the Rab23-/- lambdoid suture (n = 6 for each genotype). Data represented as mean ± SD, paired Student’s t-test was used. Statistical significance was defined as a p-value <0.05 (*). (J) Exogenous FGF10 treatment for 3 hr on Wt calvaria derived (CD) cells and subsequent Fgfr1b and Fgfr2b mRNA analysis by q-PCR shows induction of Fgfr1b expression in FGF10 treated cells compare to untreated Wt CD cells (n = 3 for each genotype). Gene expressions were normalized by 18S rRNA. Data are represented as mean ± SD, paired Student’s t-test was used and relative gene expression is shown using ΔΔCт values. Statistical significance was defined as a P-value.


