
Fig. 2. Structural and electromechanical properties of three nanomesh strain gauges fabricated from different diluted PDMS solutions.
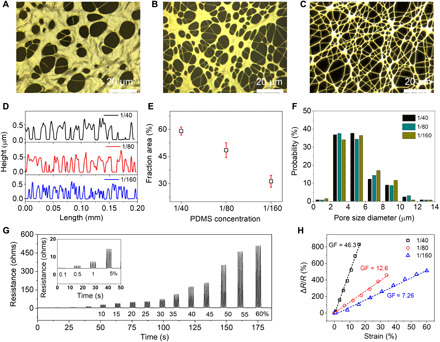
(A to C) Microscopic characterization: (A) 1/40, (B) 1/80, and (C) 1/160 (w/w of PDMS/hexane). (D) Comparison of the surface profiles. (E) Comparison of the area fractions. (F) Comparison of the probability on pore size diameter. (G) Dynamic stretching/releasing electrical performance of the 1/40 sample in the strain range of 0.1 to 60%. (H) Linear sensitivities in the range of 0 to 16%, 0 to 35%, and 0 to 60% strain for the 1/40, 1/80, and 1/160 nanomesh sensors, respectively.