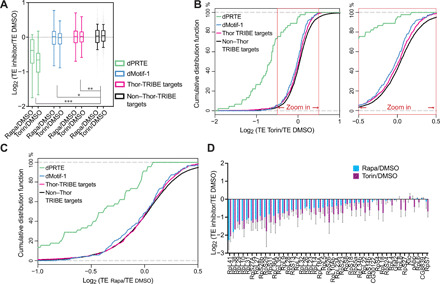
Fig. 3. Ribosome profiling data show that the TE change of Thor-TRIBE target after mTOR inhibition has a down-regulation compared with non–Thor-TRIBE target.

(A) The mean TE change of Thor-TRIBE targets is down-regulated compared with nontargets when mTOR pathway is inhibited by mTOR inhibitor, rapamycin, or Torin-1. The degree of decrease varies with different groups of Thor-TRIBE targets. Box plot of mean TE change (log2 value) after a 2-hour treatment with mTOR inhibitor versus vehicle DMSO from different groups of expressed transcripts, including all non–Thor-TRIBE targets (black, n = 5604), Thor-TRIBE targets (purple, n = 919), Thor-TRIBE targets with dMotif-1 (blue, n = 142), and Thor-TRIBE with dPRTE (green, n = 45). Ordinary one-way analysis of variance (ANOVA): *P < 0.05, **P < 0.01, and ***P < 0.001. (B and C) Cumulative frequency distribution of log2 TE fold-change values from non–Thor-TRIBE targets (black, n = 5604) and different groups of Thor-TRIBE targets showed that Thor targets have significantly different TE change from nontargets. Torin-1 versus DMSO shown in (B); rapamycin versus DMSO shown in (C). (D) TE of most Thor-TRIBE targets with dPRTE decreased after treatment of mTOR inhibitor. The bar chart showed log2 TE fold-change value of Thor-TRIBE targets with dPRTE (rapamycin/DMSO, blue bar; Torin-1/DMSO, purple bar; n = 3, +SEM).
