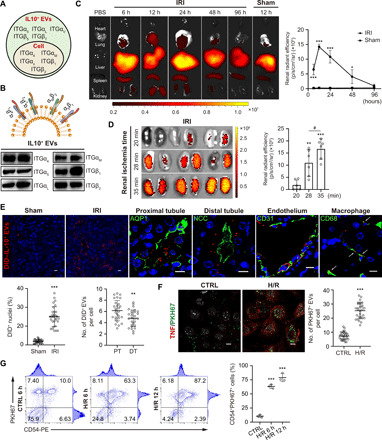
Fig. 2. Kidney targeting of IL-10+ EVs.

(A) LC-MS/MS analysis of the protein composition of IL-10+ EVs, with the parental RAW cells as the control. Integrin expression identified in IL-10+ EVs and parental cells was shown. (B) Western blotting analysis of ITGα4, ITGα5, ITGαL, ITGαM, ITGβ1, and ITGβ2 on IL-10+ EVs. (C to E) For in vivo distribution, mice were injected intravenously with DID-labeled IL-10+ EVs (n = 3). (C) Imaging of fluorescence intensity of indicated organs at 6, 12, 24, 48, and 96 hours after injection (35 min ischemic time). (D) Imaging of fluorescence intensity at 12 hours in IRI kidneys of 20-, 28-, and 35-min ischemic time. (E) Representative confocal images showing the accumulation of DID-labeled IL-10+ EVs in tubules including proximal tubule [aquaporin 1 (AQP1)] and distal tubule [NaCl cotransporter (NCC)], endothelia cells (CD31), and macrophages (CD68) in frozen kidney sections. DT, distal tubule; PT, proximal tubule. Scale bars, 10 μm. (F and G) Cellular uptake of PKH67-labeled IL-10+ EVs in H/R-induced TECs (n = 3). (F) Representative confocal images and quantification of PKH67-labeled IL-10+ EVs in each cell after 12 hours of incubation. Immunostaining of TNF was used to indicate the cellular inflammation. Scale bar, 10 μm. (G) Flow cytometry analysis of the CD54+PKH67+ cells. PE, phycoerythrin. Data are presented as means ± SD. #P < 0.05, **P < 0.01, ***P < 0.001, two-tailed t test (C, E, and F) and one-way ANOVA (D and G).
