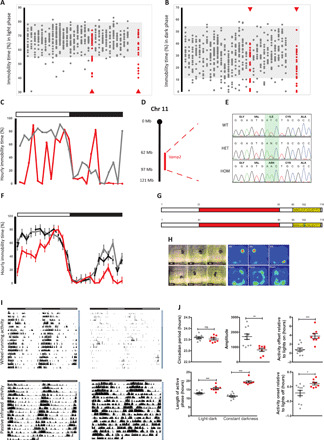
Fig. 1. ENU sleep duration screen identifies a G3 pedigree with a mutation in Vamp2.

Percent immobility-defined sleep during light (A) and dark (B) phases. Individuals from G3 pedigrees are shown in columns. Shaded areas represent normal immobility range. Arrowheads indicate the first and second cohorts of the pedigree. (C) Percentage hourly immobilities for an affected individual (red) and unaffected littermate (black). Light (open bar) and dark (filled bar) phases are indicated above the graph. (D) Mapping of affected individuals identified a 35-Mb region on Mmu11 including the Vamp2 locus. (E) Whole-genome sequencing identified a single mutation in affected animals, resulting in an Ile102Asn substitution in the transmembrane region (yellow) of VAMP2 (G); SNARE motif shown in red. (F) Hourly immobility percentages in homozygotes (red), heterozygotes (black dashed), and wild types (WT) (black). (H) Sleep patterns from video stills and heat maps over the duration of the light phase in WT (top panels) and homozygotes (bottom panels). (I) Double-plotted actograms of WT (left panels) and homozygotes (right panels). Top panels show wheel-running activity, and bottom panels show movement using passive infrared (PIR) sensors. Light and dark horizontal bars represent periods of light and dark where appropriate. Vertical bars to the right represent periods of 12:12 light dark (white) or constant darkness (gray). (J) Circadian measures in WT (gray) and homozygotes (red) calculated from PIR data. Individual data points are shown as means ± SEM, *P < 0.05, **P < 0.01, ***P < 0.001. ns, not significant.
