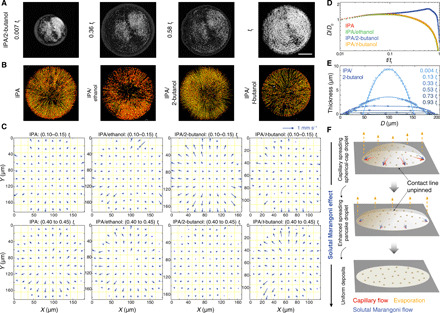
Fig. 2. Solutal Marangoni effect.

(A) Optical micrographs of a drying droplet of IPA/2-butanol (10 volume %) with tracer particles on glass from droplet impact (0.007 tf), to maximum spreading (0.36 tf), to when the edge recedes close to the particle periphery (0.58 tf), and at the end of drying (tf). Scale bar, 50 μm. The brightness and contrast are optimized for clarity. (B) Particle trajectories at 0.04 tf to 0.05 tf, with red arrows showing the trajectory end, and (C) the corresponding velocity maps averaged over two time intervals: For IPA, IPA/ethanol, and IPA/t-butanol, the particles nearest to the pinned contact lines display largest velocities and increase from ∼0.3 to ∼0.6 mm s−1; for IPA/2-butanol, the contact line and the near particle first advance at ∼0.5 mm s−1. The droplet then ceases to expand, and the particle velocities greatly decrease. Polystyrene nanoparticles (diameter ~755 nm) are used as tracer particles as 2D crystals are too small to visualize. Stationary particles adhering to substrates are excluded from analysis. (D) Contact diameter (D) of droplets without tracer particles as a function of time. The time is normalized by tf and D by the diameter just after (1 ms) inertial droplet impact (D0). (E) Reconstructed height profiles of an IPA/2-butanol droplet at various times (movies S6 and S8). Solid line at 0.004 tf and 0.13 tf is circular fit. (F) Schematic depicting the solutal Marangoni effect.
