
Fig. 5. Laminar distribution of BHA and MUA in the human prefrontal cortex.
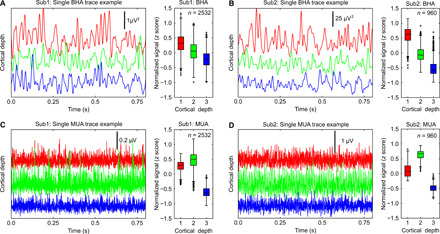
Line plots show example traces from simultaneous BHA (A and B) and MUA (C and D) recordings during rest in two patients with epilepsy implanted with linear probes in a to-be-resected tissue. Signals were assigned into three a priori depths (1, 150 to 900 μm; 2, 1050 to 1800 μm; and 3, 1950 to 2850 μm) based on known thickness of the cortex (see Materials and Methods). The whole resting data were segmented into 1-s-long intervals (100-ms-long intervals at side of epoch were removed after filtering to avoid contamination of edge effects). The laminar distribution of BHA and MUA was quantified by testing for nonuniformity of BHA and MUA across depths (see Materials and Methods). Box plots present results aggregated across all BHA (A and B) and MUA (C and D) epochs in each patient separately. Box plots indicate 25th percentile, median, and 75th percentile; whiskers extend to extreme values not considered outliers. Outliers are shown as “+” signs.