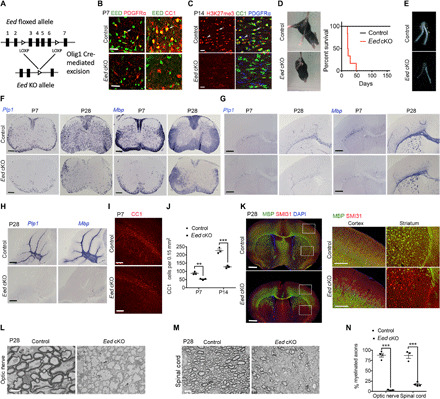
Fig. 1. Eed cKO mice develop myelination defects in the CNS.

(A) Diagram depicting generation of Eed cKO mice. (B) Immunostaining for EED, PDGFRα, and CC1 in control and Eed cKO spinal cords at P7. (C) Immunostaining for H3K27me3, CC1, and PDGFRα in control and Eed cKO brains at P14. Arrows indicate H3K27me3+CC1+ OLs; arrowheads indicate H3K27me3+ PDGFRα+ OPCs. (D and E) Photographs of control and Eed cKO mice, survival curves, and optic nerves at P28. (F to H) In situ hybridization analyses for Plp1 and Mbp in the spinal cord, brain, and cerebellum from control and Eed cKO mice. (I and J) Immunostaining for CC1 (I) and quantification of CC1+ OLs (J) in control and Eed cKO brains (n = 3 animals per genotype). (K) P28 control and Eed cKO brains immunolabeled for MBP and SMI31 are shown on the left. Boxed regions are magnified to the right. (L to N) Electron micrographs (L and M) and quantification of myelinated axons (N) in P28 control and Eed cKO optic nerves and spinal cords (n > 3 animals per genotype). Scale bars, 20 μm (B and C), 200 μm (F to I), 1 mm (K), 1 μm (L), and 4 μm (M). Data are means ± SEM. **P < 0.01, ***P < 0.001. DAPI, 4′,6-diamidino-2-phenylindole. Photo credit: Jiajia Wang, CCHMC.
