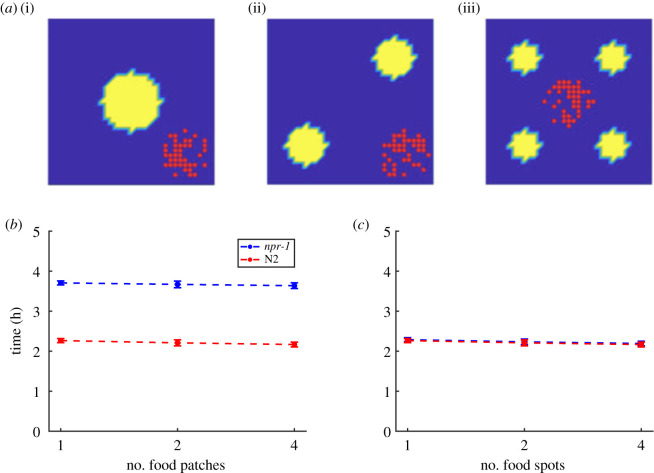
Figure 5.
Strain-specific model simulations with multi-spot food environments. (a) Food distributions with (i) one, (ii) two or (iii) four food spots. Red dots show agent configurations at the start of the simulations, clustered to mimic the experimental procedure of transferring worms together in a liquid droplet. Dark blue indicates no food and yellow indicates food. (b) Time for npr-1 and N2 agents to deplete 90% of the distributed food units, shown for different numbers of food spots. Error bars show 1 s.d. (c) The same as (b), but with npr-1 agent feeding rate set to the same value as N2. Simulation time is converted from time steps to real time in (b) and (c): as there is maximally a single agent per lattice site the lattice spacing is equal to the worm size (approx. 1 mm). By noting that worm speed on food is approximately 100–200 µm s−1 and that it takes an agent one time step to cross the 1 mm lattice site, the timescale should be roughly Δt ≈ 5–10 s. Eventually Δt = 10 s is chosen to approximate the order of magnitude to broadly match the experimental data in figure 4.

