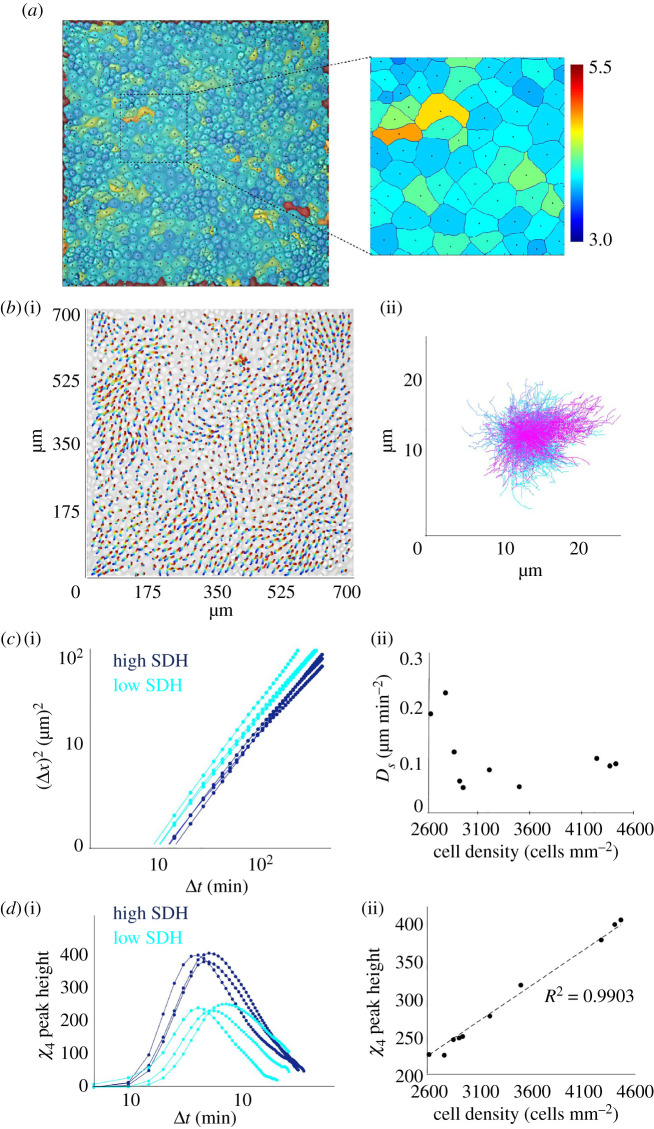
Figure 2.
Linking cell density and dynamic heterogeneity. (a) Overlapped brightfield and segmented cell boundaries, showing the centroid of each cell. Colours were assigned according to the shape index. (b) (i) PIV-derived cellular trajectories, mapped onto the initial brightfield image. (ii) Compilation of all cell trajectories with starting position of every cell set to zero. (c) (i) Evolution of mean square displacement (MSD) with time at different cell densities. (ii) Variation of effect diffusion coefficient, as calculated from the graph in (i), with increasing cell density. (d) (i) The shape of four-point susceptibility function with respect to time at different cellular densities. (ii) Variation of the peak height of four-point susceptibility function, as calculated from the graph in (i), with increasing cell density. For the linear fit, R2 = 0.9903, implying a high linearity.

