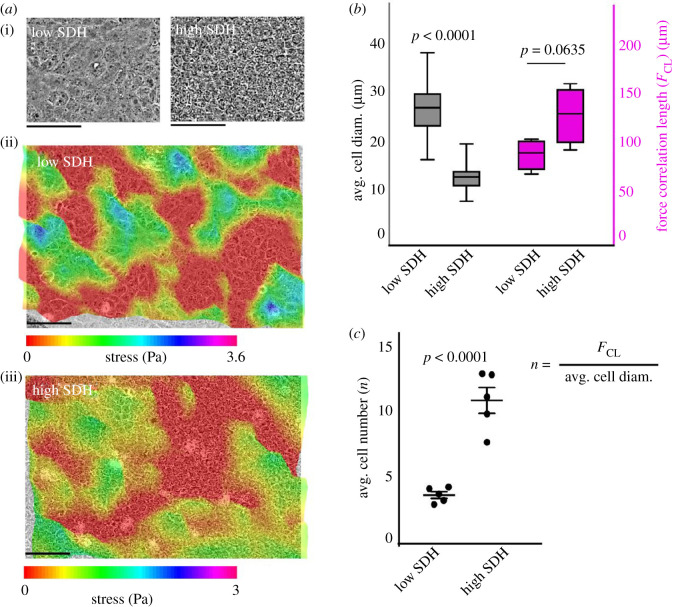
Figure 3.
The strength of dynamic heterogeneity influences the force correlation at the multicellular level. (a) Representative phase contrast images and stress profile of the monolayers at a representative low and high SDH value. (b) Box plots showing average cell diameter (plotted on left y axis) and force correlation lengths (plotted on right y axis) for low and high SDH, showing no significant difference in correlation lengths. (c) Average number of cells correlating force normalized with cell diameter at low and high density showing that cells coordinate much more at higher SDH.

