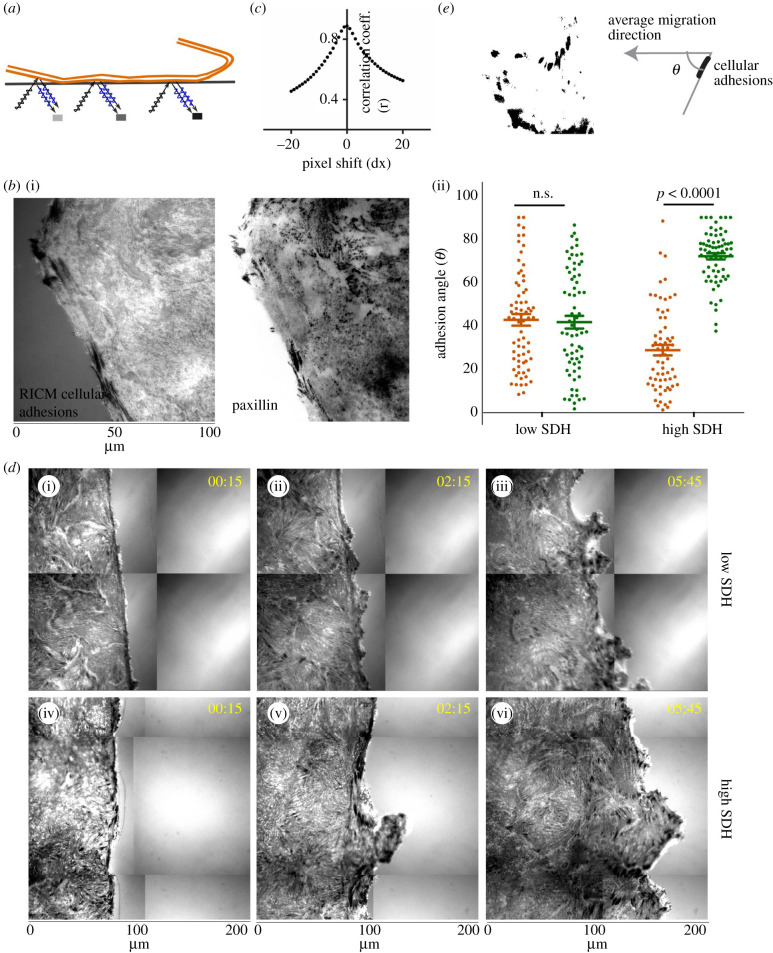
Figure 5.
Cellular adhesion patterns at low and high dynamic heterogeneity. (a) Schematic representation of Reflection Interference Contrast Microscopy (RICM) for measuring dynamic cellular adhesions. (b) Cellular adhesions as measured by RICM (i) and focal adhesions from paxillin staining (ii). (c) Colocalization analysis using the Pearson correlation coefficient showing RICM adhesions colocalized with focal adhesions, as stained with an antibody against paxillin. (d) Representative time lapse images of cellular adhesions at low and high SDH showing leaders orient towards the direction of migration and non-leaders towards the leader cell at SDH. (e) Scatter dot plot of focal adhesion orientation angles in leader and non-leader cells with respect to the direction of migration.

