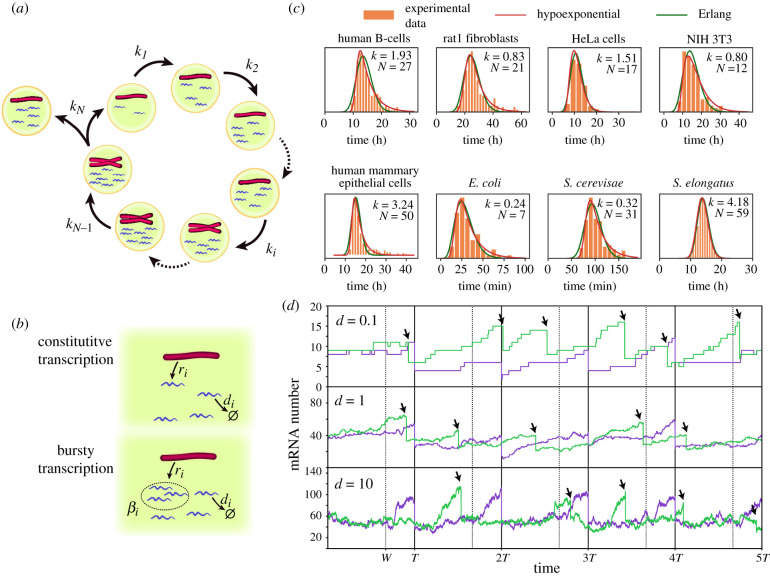
Figure 1.
(a,b) Schematic of the general model where mRNA dynamics take into account details of the cell cycle (a) including DNA replication of a gene, phase duration variability and bipartition of mRNA content at mitosis. During each cell cycle stage (b) mRNA dynamics is described as a production term (constitutive or bursty), and a linear degradation. (c) The Erlang and hypoexponential distributions provide excellent fits to the experimental probability distributions of cell cycle durations of eight different cell types. The parameters of the Erlang distribution (k, N) are shown on the figure. The sources of the experimental data, together with the parameters of the hypoexponential distribution (k1, N1, k2, N2) with N1 stages of rate k1 and N2 stages of rate k2 are: B-cells (11.7, 132, 0.26, 1) [21], Rat1 fibroblasts (0.15, 1, 2.4, 50) [22], HeLa cells (0.71, 4, 20.0, 110) [23], NIH 3T3 fibroblasts (0.24, 2, 11.4, 98) [19], mammary epithelial cells [24] (0.32, 1, 11.4, 154), Escherichia coli (0.88, 16, 0.07, 1) [25], Saccharomyces cerevisae (0.04, 1, 1.4, 115) [26] and Synechococcus elongatus (4.18, 30, 4.18, 28) [27]. Fitted distributions correspond with the least-squares fit of the distance between the experimental histograms and the probability density functions using the Trust Region Reflective algorithm implemented in SciPy. (d) Comparison of stochastic mRNA trajectories between a case where cell cycle duration is constant (purple) or stochastic (green), for different degradation rates d. Arrows indicate stochastic division times. Stochastic cell cycle simulations use the Erlang model with a production rate per chromosome equal to r = 50d for a cell cycle with N = 4 stages, from which W = 3 stages occur prior to the gene replication (w = W/N = 3/4) indicated by dashed lines for the deterministic simulations.

