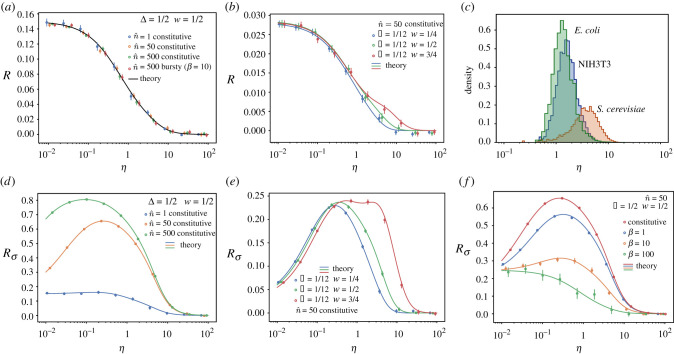
Figure 2.
Relative error made in the average number of mRNAs (R) and its variance () when considering the cell cycle to be deterministic instead of Erlang distributed in a non-proliferating population or a lineage. Panels compare the theoretical results (lines) with stochastic simulations (circles). (a,b) Relative error R of the mean number of mRNA. (c) Genome-wide values of η for three different cell types. NIH3T3 mouse fibroblast data was obtained from [33]. Degradation rates for S. cerevisiae cultured in yeast extract peptone dextrose were obtained from [32] and its cell cycle duration from [34]. Stability data for the transcripts of E. coli cultured in Lysogeny broth were obtained from [31], while its cell cycle duration is taken from [35]. Averages are done over trajectories of duration t = 600Tmax (1/dT, 1/rT, 1). (a,b,f) Averages over 50 trajectories for all conditions except for , which shows an average of 500 trajectories. (d,e) Averages over 200 trajectories. Error bars indicate the standard error of the mean.

