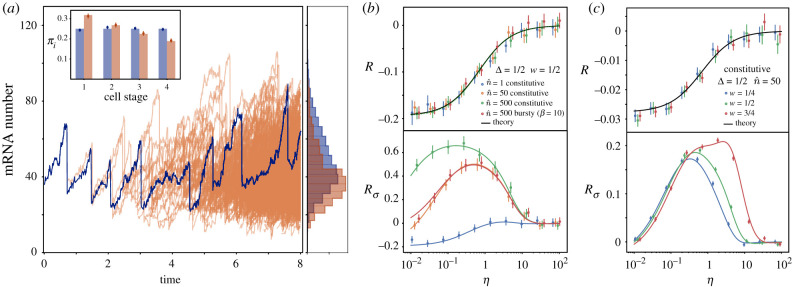
Figure 3.
(a) Comparison between the mRNA content over a single-cell trajectory in time (blue) with the mRNA distribution of a proliferating population (orange). Histograms for both mRNA distributions (right) compare the average of 100 trajectory realizations with the snapshot of a single population at t = 7T. Parameters used are T = 1 , N = 4, W = 2 , , η = 1. (Inset) Probability distribution πi of finding a cell at different cell cycle stages for single trajectory (blue) and a proliferating population (orange). Stochastic simulations for πi (circles) are compared with theoretical results (bars) obtained from equation (4.2) (that for the Erlang case is constant πi = 1/N) and from equation (5.4). (b,c) Relative error made in the average number of mRNAs (R) and its variance () when considering the cell cycle to be deterministic instead of Erlang distributed in a growing proliferative population. Comparison includes theoretical results (lines) and stochastic simulations (circles). Simulations in (b) show the average of 5000 snapshots at a time 10 T and in (c) the average of 25000 snapshots at a time 10 T. Error bars indicate the standard error of the mean.

