Figure 4.
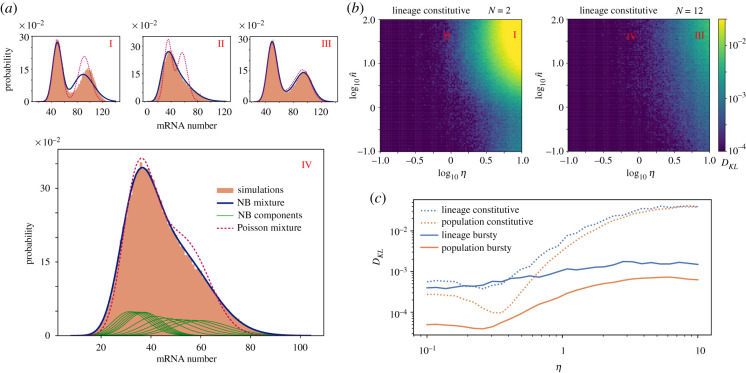
Approximation of the mRNA distribution as a mixture of negative binomials (NBs). (a) Comparison between the approximations for the mRNA distribution (Poisson mixture and negative binomial mixture) with simulations for four different cases: I (N = 2, η = 10, ), II (N = 2, η = 1, ), III (N = 12, η = 10, ) and IV (N = 12, η = 1, ). Case IV also includes the individual components of the NB mixture. (b) Kullback–Leibler divergence of the NB binomial mixture from stochastic simulations for lineage distributions of constitutive mRNA expression. (c) Comparison of the Kullback–Leibler divergence from simulations of the NB mixture for combinations of lineage/population measures and constitutive/bursty (β = 10) expression. For all the panels w = 1/2. Distributions for (a) and (b) result from trajectories over a time t = 6 × 104 Tmax (1/dT, 1/rT, 1), while for (c) we used t = 6 × 10⁶T/d · max (1/dT, 1/rT, 1) for lineage measurements, and t = 20T for population measurements.

