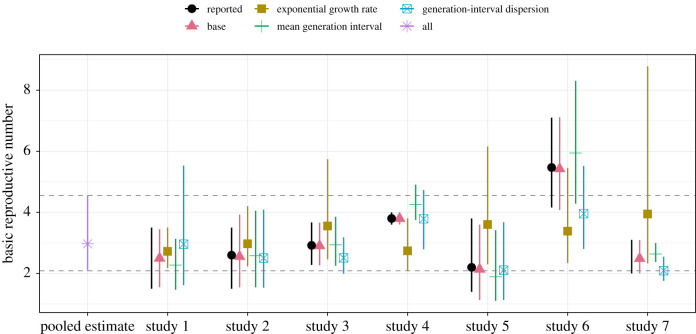
Figure 3.
Sensitivity of the reported estimates with respect to our pooled estimates of the underlying parameters. We calculate substitute estimates by replacing the reported parameter values (growth rate r, mean generation interval and generation-interval dispersion κ) with our corresponding pooled estimates (μr, μG and ) one at a time and recalculating . The pooled estimate represents , which is calculated from the joint posterior distribution of μr, μG and ; this corresponds to replacing all reported parameter values with our pooled estimates, which gives identical results across all studies. The reported estimates refer to estimates listed in table 1. Points represent the medians of the reported, base, substitute and pooled estimates. Vertical error bars represent the 95% credible intervals of our base, substitute and pooled estimates (based on 2000 posterior samples). Horizontal dashed lines represent the 95% credible intervals of our pooled estimate.

