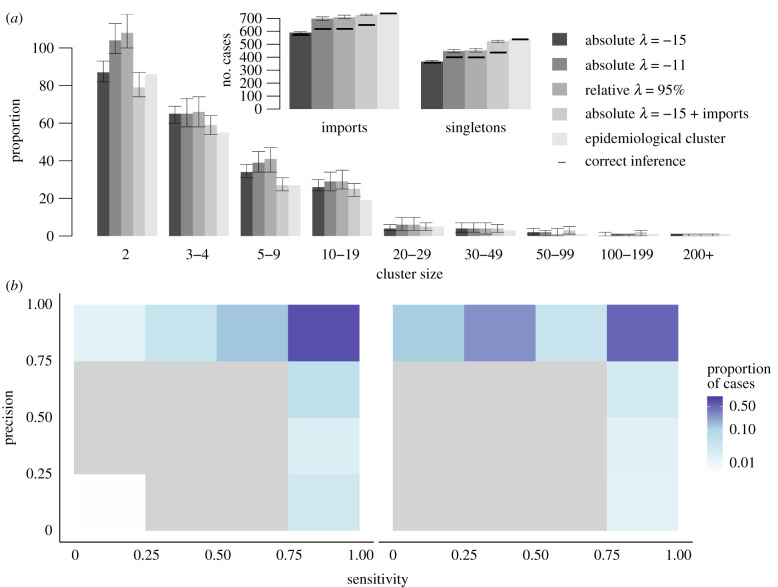
Figure 5.
Description of transmission clusters generated with inferred importation status of cases. (a) Cluster size distribution for different value of threshold in scenario 3 (sorted by shades of grey), compared to the reference clusters (light grey). Arrows represent the 95% credibility intervals of each estimate. Only clusters containing at least two cases are represented. Inset: Number of importations and number of isolated cases (singletons). For each scenario, the horizontal dark line represents the number of importations that are also importations in the reference clusters, same for singletons. (b) Heatmap representing the precision and sensitivity of the clusters for each case in scenario 3, with a 5% relative threshold, cases are classified in a category depending on the proportion of their reference cluster that were inferred in the same cluster. (c) Same when importation status is taken from the contact-tracing investigations and inferred using a 5% relative threshold.

