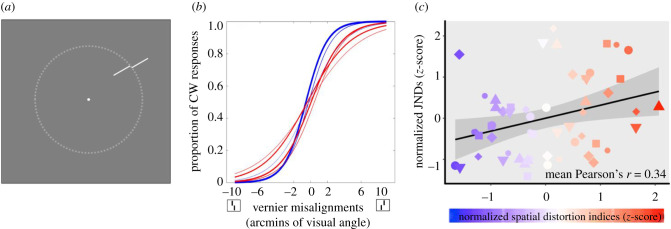
Figure 2.
Paradigm and results for Experiment 2. (a) Example Vernier stimuli. Stimuli were shown on an invisible circle with a radius of 6 d.v.a. (dotted line). (b) Psychometric curves fitted for one representative subject. The colours of the lines correspond to locations in the visual field that had different types of distortion (blue for compression and red for expansion, as measured in Experiment 1); the weights of the lines correspond to the intensity of the distortion. (c) A visualization of the correlation between Vernier acuity JNDs (Experiment 2) and corresponding spatial distortion indices (Experiment 1) for all 7 observers (represented by different shapes and sizes) collapsed into a single super-subject. Blue shading indicates more contracted locations and red shading indicates more expanded locations from Experiment 1. The black line is the best-fitted linear regression line based on this super-subject data and the grey-shaded area represents the 95% CI of the linear fit. There was a significant positive correlation between the degree of visual space distortion and Vernier JNDs, indicating that better acuity was found at perceptually contracted visual space compared to expanded visual space. (Online version in colour.)

