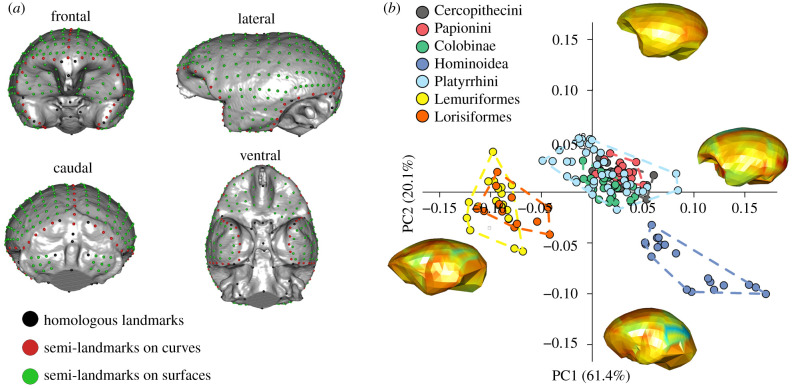
Figure 1.
Brain shape variation in Primates. (a) Landmarks and semi-landmarks used to record brain (endocast) shape variability. (b) Scatterplot of PC1/PC2 scores of brain endocast shape variables in Primates. The warped meshes refer to positive and negative extremes of the axes. Mesh colours indicate the magnitude of shape changes associated with each axis, from low deformation (cool colours) to high deformation (warm colours). (Online version in colour.)

