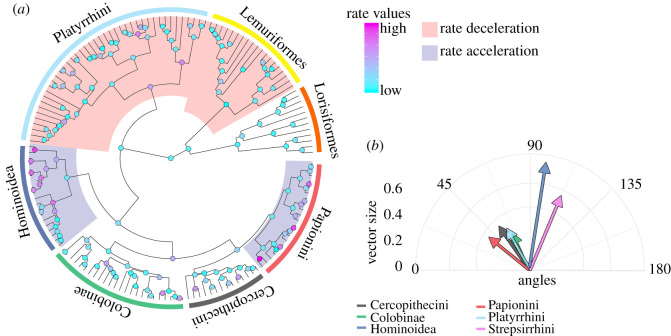
Figure 3.
Rates and trajectories of brain shape evolution. (a) Distribution of evolutionary rate shifts on the Primates tree. The red shades represent clades showing evolutionary rate slowdowns (Strepsirrhini, p = 0.01; Platyrrhini, p = 0.021). The blue shades represent clades showing evolutionary rate acceleration (Hominoidea, p = 0.01; Papionini, p = 0.001). (b) Direction and magnitude of shape changes of Primate clades. The angles are calculated in reference to the brain shape at the tree root and reported in two dimensions, taking the mean angle to represent each clade. (Online version in colour.)

