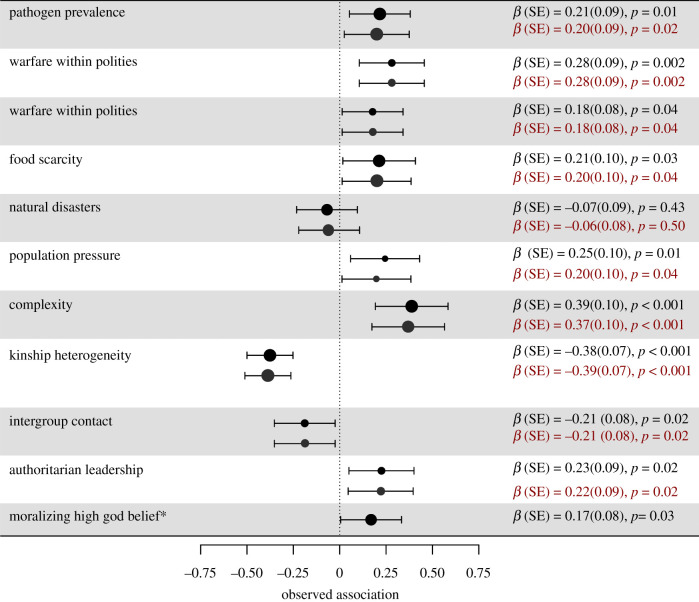
Figure 3.
Associations between cultural tightness and its theorized antecedents (top 10 variables) and consequences (bottom three variables). Node size indicates the number of societies in the analysis. Black nodes represent multi-level models nested in society; red nodes represent multi-level models nested within society and language family. Effect sizes and p-values are displayed on the right, and additional statistics for each model are available in the electronic supplementary material. Moralizing high god belief has an asterisk because the three-level model controlling for language family did not converge, and we did not interpret this model. (Online version in colour.)

