Fig. 3.

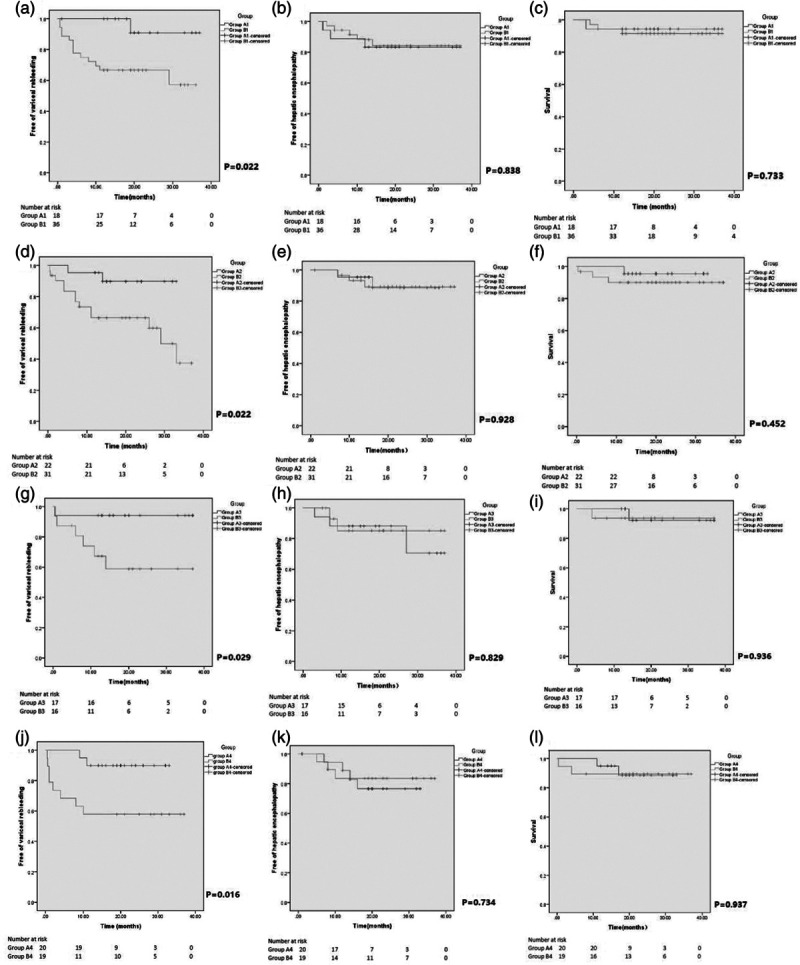
Kaplan–Meier curve shows the probalility of free of vairceal rebleeding (A1–A4) free of hepatic encephalopathy (B1–B4) and survival (C1–C4) between the subgroups A1–A4 and subgroups B1–B4.

Kaplan–Meier curve shows the probalility of free of vairceal rebleeding (A1–A4) free of hepatic encephalopathy (B1–B4) and survival (C1–C4) between the subgroups A1–A4 and subgroups B1–B4.