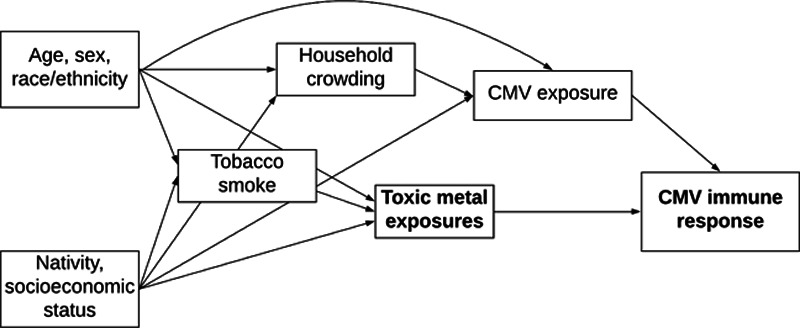
Figure 2.

Directed acyclic graph showing the posited relationships between sociodemographic and lifestyle characteristics with toxic metal exposures and CMV. The bolded text represents the exposures (toxic metals) and outcomes (CMV seropositivity, recurrence, and IgG antibody level) of interest.
