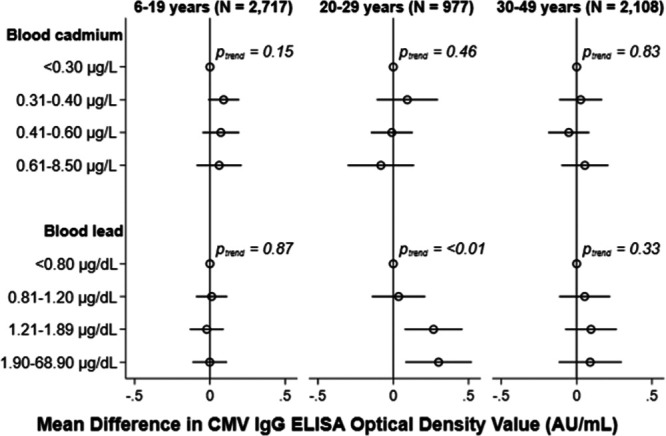
Figure 5.

Adjusted cross-sectional associations of blood cadmium (upper) and blood lead (lower) with CMV IgG antibody levels by age group, NHANES 1999–2004. Mean differences (95% CI) adjusted for age, sex, race/ethnicity, education, family income: poverty line, nativity, serum cotinine, and household crowding with mutual adjustment for blood cadmium and lead categories. Mean differences were weighted to account for the complex survey design and 95% CIs were estimated using Taylor series linearization.
