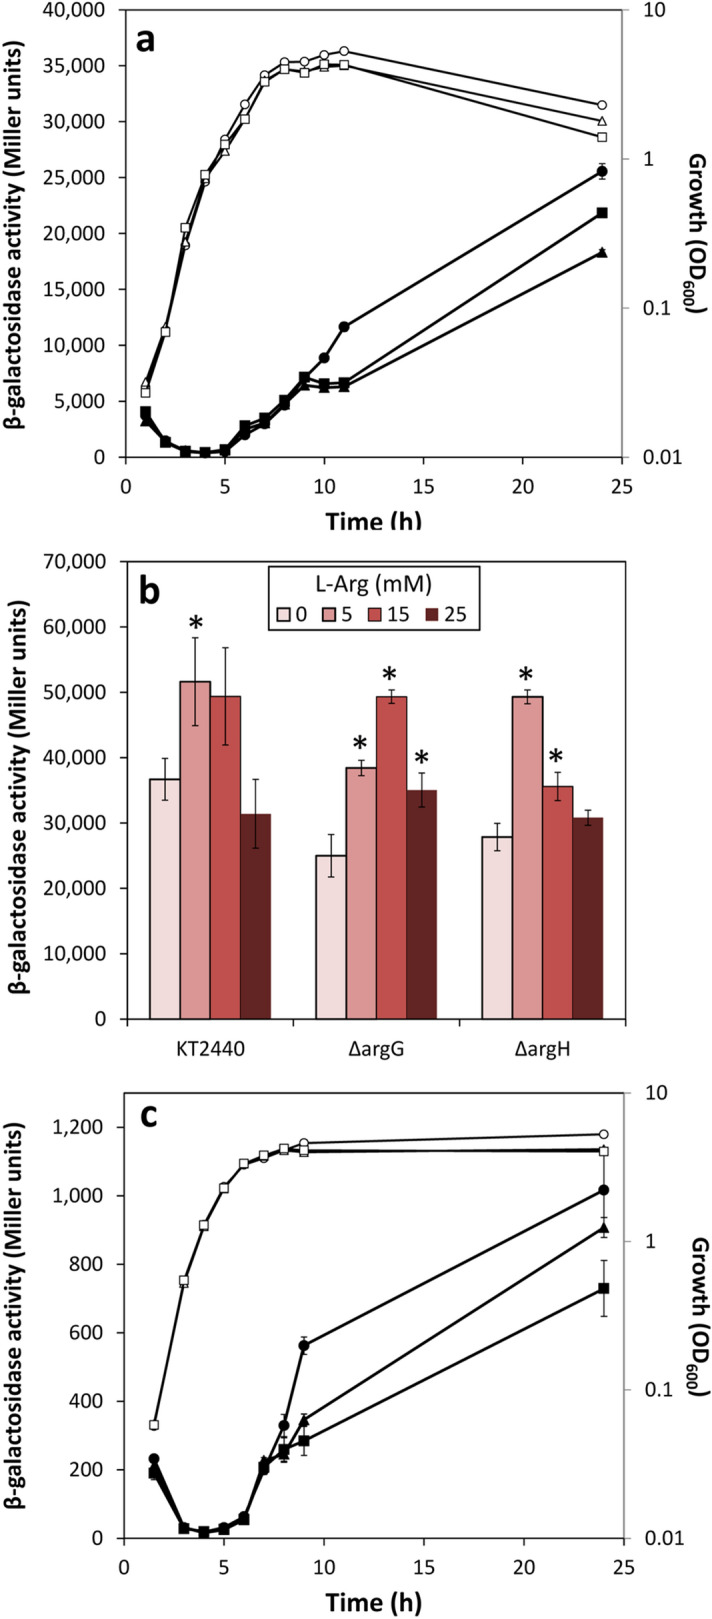
Figure 6.

Influence of l-arginine biosynthesis on expression of rpoS and cfcR. (a) KT2440 (circles), and the ΔargG (triangles) and ΔargH (squares) strains harbouring pMAMV21 (rpoS’–‘lacZ) were grown in LB and β-galactosidase activity was measured at the indicated times. Data correspond to averages and standard errors of two biological replicas with three technical repetitions each. Statistically significant differences between the wild type and mutants were detected from 10 h onwards (Student´s t test: p < 0.05). (b) Influence of increasing concentrations of l-arginine on expression of rpoS’–‘lacZ in KT2440 and the ΔargG and ΔargH strains harbouring pMAMV21. Cultures were grown for 24 h in LB or LB with increasing concentrations of l-arginine (shown as increasing intensity colour bars) and β-galactosidase activity was analysed. Graph corresponds to averages and standard deviations of two biological replicas with three technical repetitions each. Statistically significant differences with respect to each control without amino acid supplementation are indicated by asterisks (Student´s t test: p ≤ 0.01). (c) KT2440 (circles), and the ΔargG (triangles) and ΔargH (squares) strains harbouring pMIR200 (cfcR::lacZ) were grown in LB and β-galactosidase activity was measured at the indicated times. Data correspond to averages and standard errors of two biological replicas with three technical repetitions each.
