Figure 11.

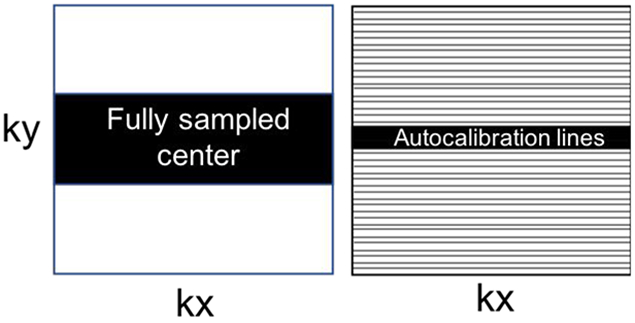
Illustration of k-space sampling patterns for super-resolution (left) and sparse sampling (right). The black regions and lines represent acquired k space lines. The white regions are zero-filled.

Illustration of k-space sampling patterns for super-resolution (left) and sparse sampling (right). The black regions and lines represent acquired k space lines. The white regions are zero-filled.