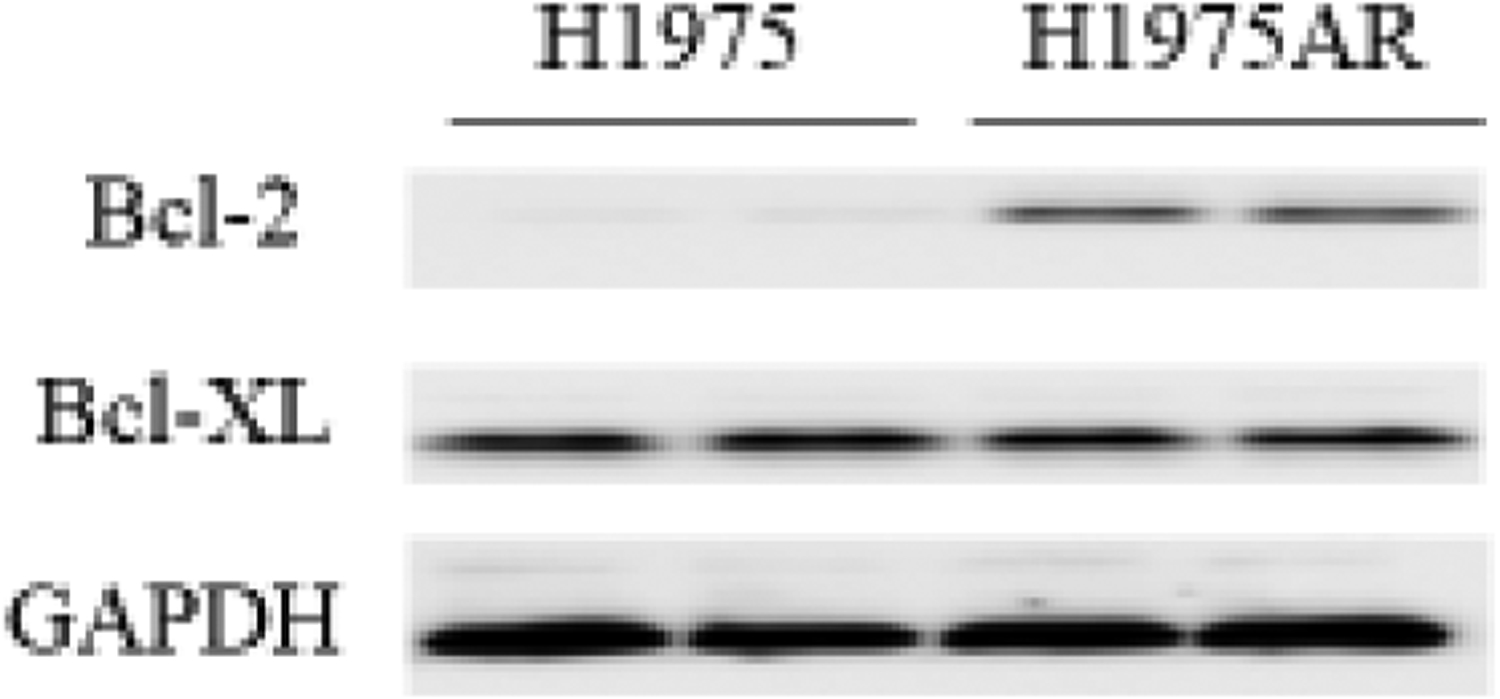
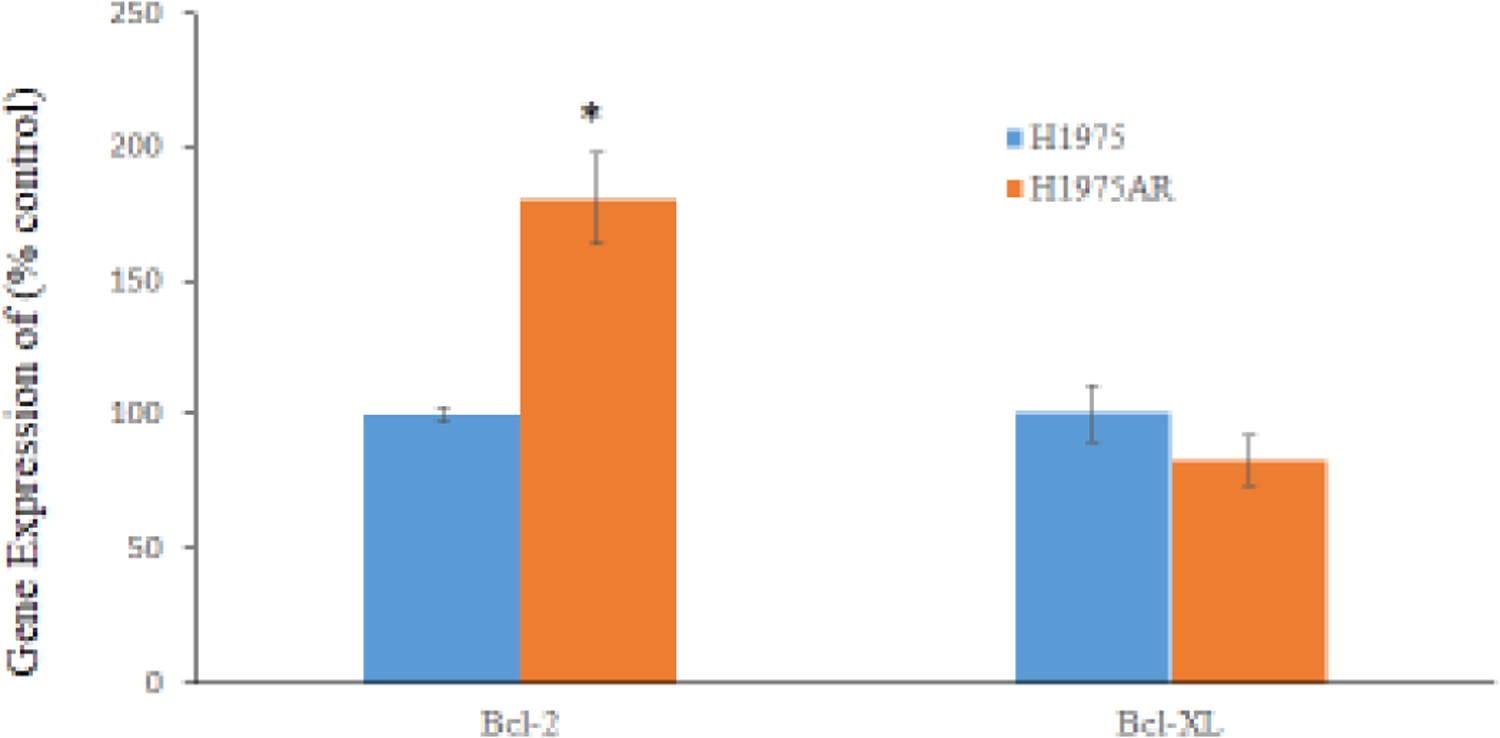
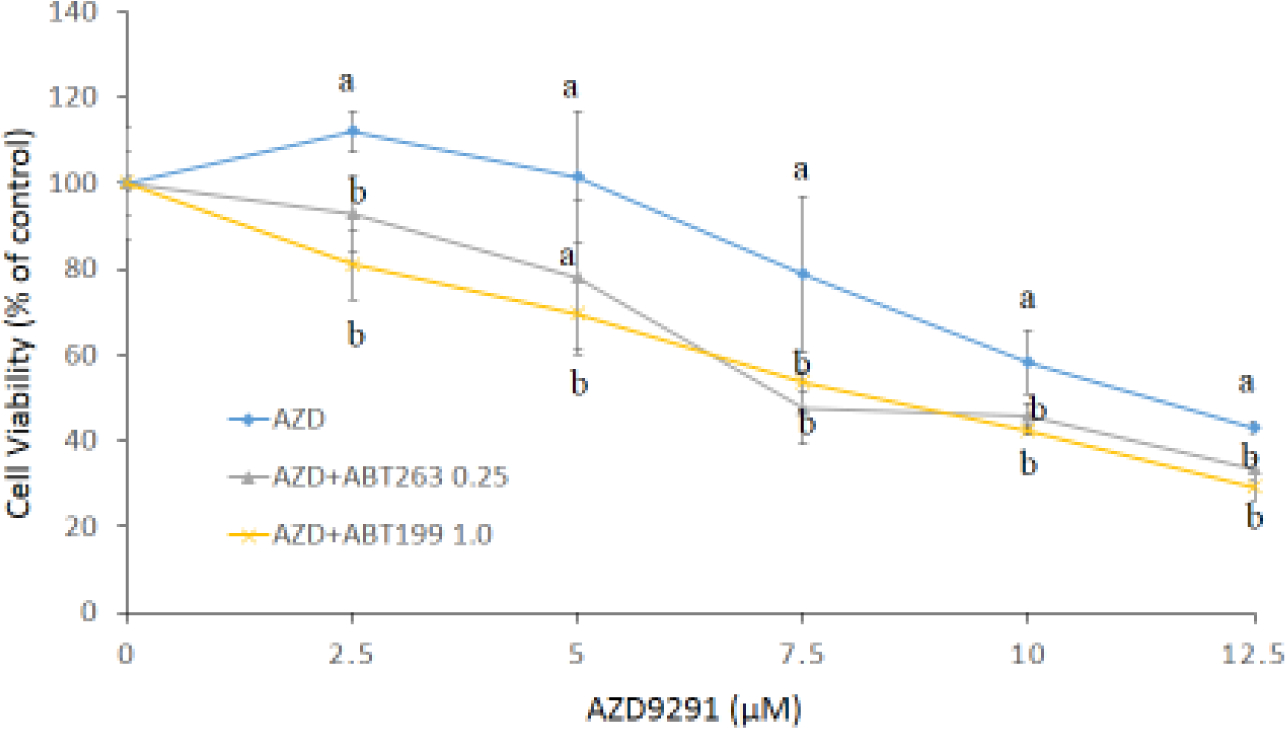
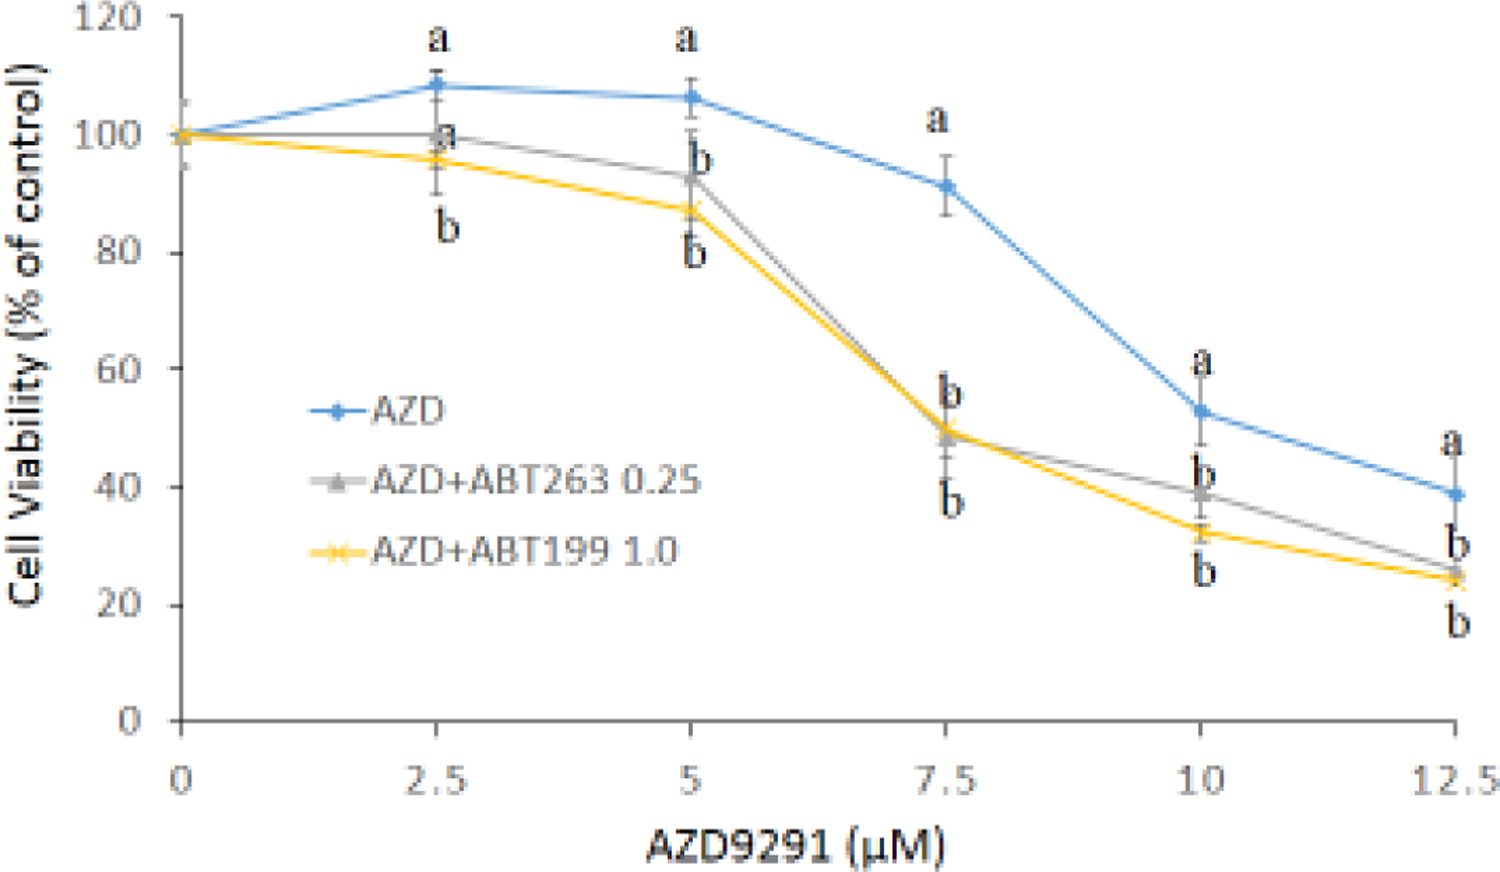
Figure 1. Bcl-2 and Bcl-XL proteins (a) and mRNA (b) expressions in H1975AR and H1975, and cytotoxic effects of AZD9291 (AZD) and/or ABT263/ABT199 in H1975AR at 24 hrs (c) and 48 hrs (d).


(a) protein and (b) mRNA expression levels in H1975 and H1975AR analyzed by Western blot and real-time PCR, respectively. * signified significant difference between H1975 and H1975AR (p<0.05). Cytotoxic effects of AZD alone and AZD+ABT263/ABT199 on the cell viability H1975AR at (c) 24 hrs and (d) 48 hrs were determined by the MTT assays. Data are expressed as the percentage by comparing to vehicle controls for AZD treatments or ABT263 (0.25 μM)/ABT199 (1 μM) for AZD+ABT263/ABT199 treatments. Values are represented as mean ± SD, n = 6. Mean values at the same concentration containing different letters indicate a significant difference among the treatment groups analyzed by a one-way ANOVA followed by a Fisher’s LSD test (p < 0.05). Values bearing the letter “a” indicate no significant differences compared with AZD treatments and those labeled “b” denote a significant difference when compared with AZD treatments.
