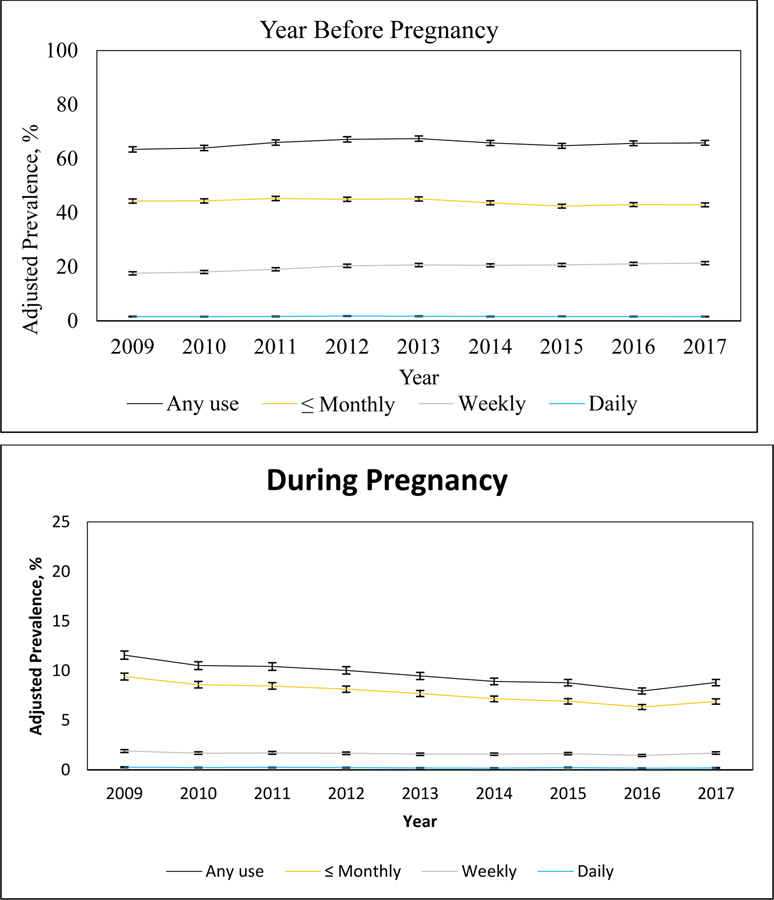
Figure 1.
Adjusted Prevalence of Self-Reported Alcohol Use in the Year Before Pregnancy and During Pregnancy, by Frequency of Use, 2009–2017 (N = 363,240).
Notes: Estimated annual relative rates of change (95% CI) for alcohol use in the year before pregnancy: Any use [1.003 (1.001, 1.005); p-value = 0.0080], ≤ Monthly use [0.994 (0.991, 0.996); p-value <.0001], Weekly use [1.023 (1.019, 1.027); p-value <.0001], Daily use [0.999 (0.990, 1.008); p-value = 0.7801]. Estimated annual relative rates of change (95% CI) for alcohol use during pregnancy: Any use [0.961 (0.956, 0.966); p-value <.0001], ≤ Monthly use [0.956 (0.951, 0.961); p-value <.0001], Weekly use [0.983 (0.974, 0.993); p-value = 0.0006], Daily use [0.962 (0.941, 0.982); p-value = 0.0003].

