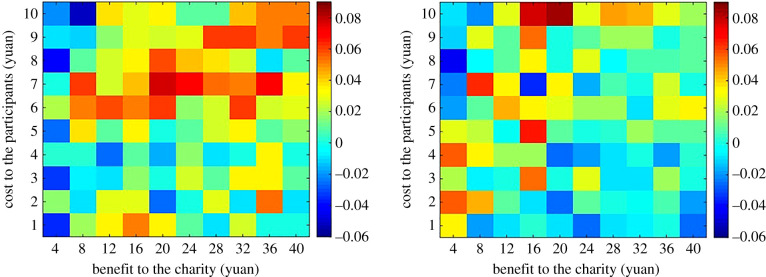
Figure 2.
Heatmap of the probability of acceptance to donate, with warmer colours indicating greater probability of acceptance in the public versus private condition (i.e. greater audience effect). Heatmap on the left refers to the testosterone group, while heatmap on the right refers to the placebo group. (Online version in colour.)

