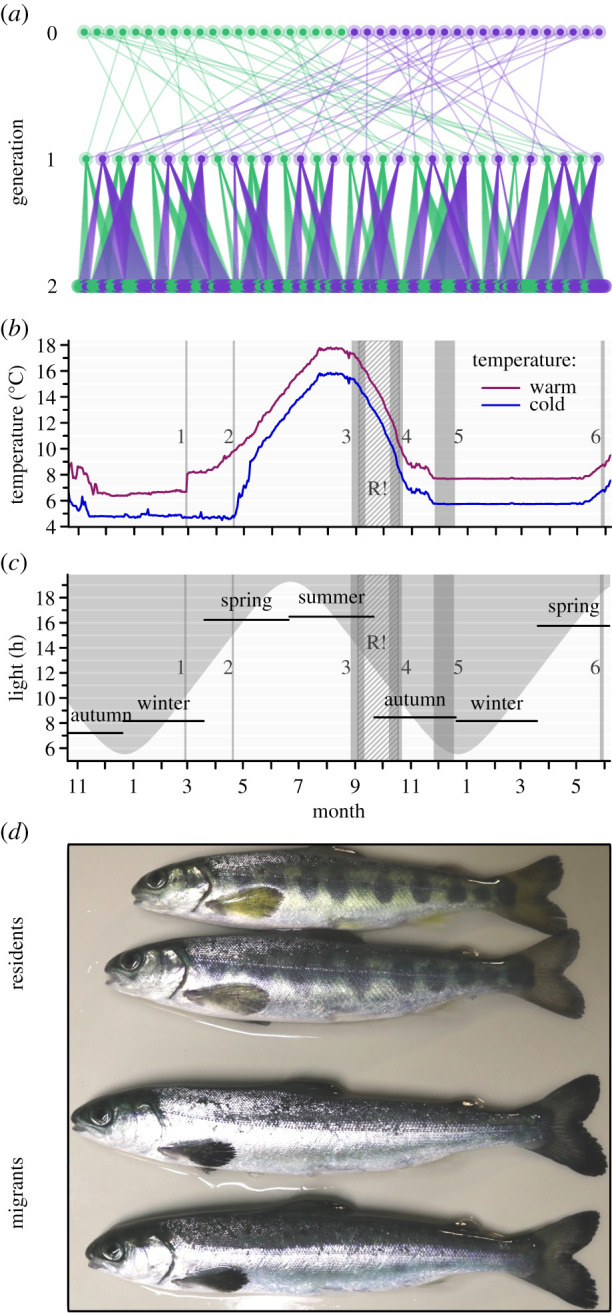
Figure 1.

Pedigree (a) depicting relatedness among experimental individuals (generation 2) and the 2 × 2 partial factorial breeding design of parents (generation 1) with females in green (appearing on the left in generation 0) and males in purple. Seasonal water temperature (b) and light-regime curve (c) with experimental timeline and data collection time points indicated (1 & 2: first feeding in warm and cold environments, respectively; 3: determination of length and mass, followed by the feed-restriction period indicated by the grey hatched rectangle marked with R!; 4: determination of length and mass after the feed restriction period; 5: determination of maturation status; 6: determination of migration phenotype). Picture of typical phenotypes of residents and migrants in spring (d). (Online version in colour.)
