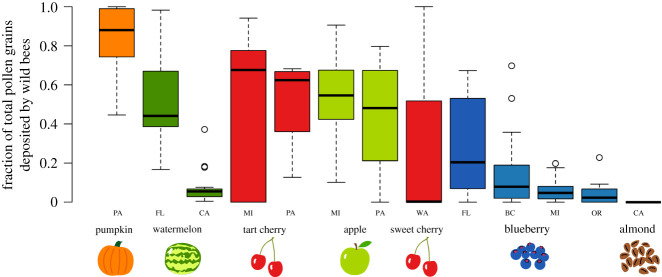
Figure 3.
Boxplots of relative pollen deposition rate of wild bees (as a proportion of total pollen deposition) across the crop–region combinations in our study. Estimates of pollen deposition were based on visits × pollen deposition per visit for each type of pollinator observed (electronic supplementary material, table S2), with the remainder of pollen deposition provided by honeybees. Black line is the median, boxes show the first and third quartiles, and whiskers extend to 1.5 times the interquartile range or to the most extreme data point. The number of farms and years differed by crop (electronic supplementary material, table S7). (Online version in colour.)

