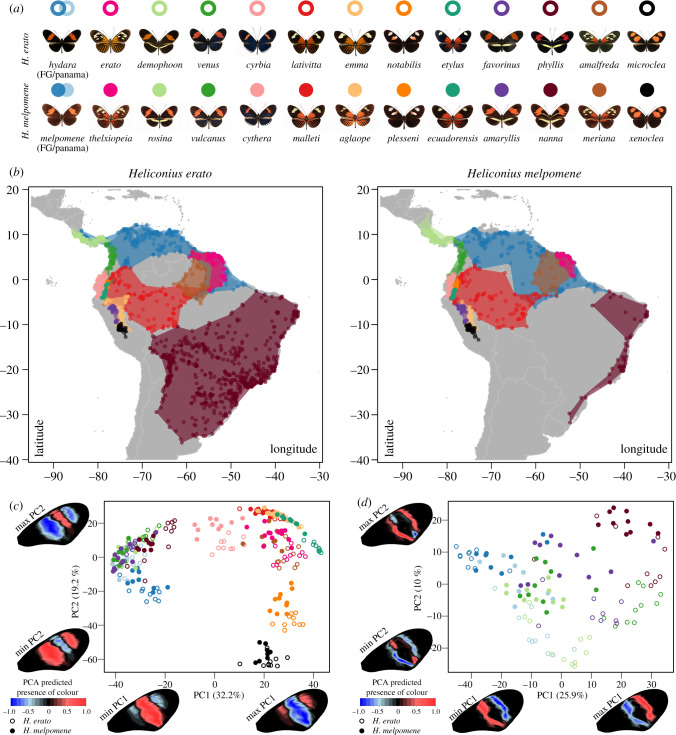
Figure 1.
Co-mimicking Heliconius erato and Heliconius melpomene colour pattern morphs, their distribution and PCA of MFB pattern. (a) Dorsal images of mimicking H. erato and H. melpomene colour pattern morphs. (b) Distribution areas of the mimicking populations as obtained from Rosser et al. [35]. (c) PCA of mid-forewing band (MFB) shape of the mimicking colour pattern morphs. (d) PCA of MFB shape of mimicking ‘Postman’ populations. Wing heatmaps indicate minimum and maximum predicted MFB patterns along each PC axis while considering the PC value of all other PC axes at zero. Positive values present a higher predicted presence of the MFB pattern (red), whereas negative values present the absence of the pattern (blue). (Online version in colour.)

