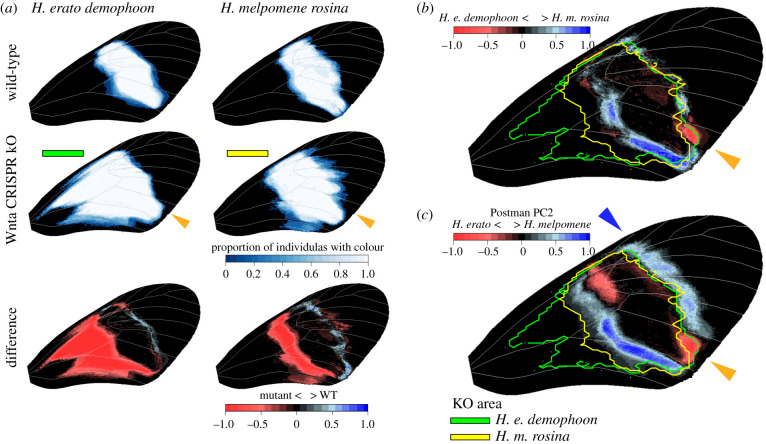
Figure 3.
Comparison of mid-forewing band (MFB) differences between co-mimicking Heliconius erato and Heliconius melpomene Postman phenotypes and WntA CRISPR/Cas9 KO phenotypes. (a) Heatmaps showing the presence of MFB in wild-type, WntA KO phenotypes and their difference for H. e. demophoon and H. m. rosina (obtained from 10 wings of five KO butterflies each [12]). (b) Comparison of WntA KO area to wild-type difference between H. e. demophoon and H. m. rosina. (c) Comparison of WntA KO area to Postman phenotype variation (figure 1). Orange and blue arrows indicate overlap in mismatch between wild-type co-mimicking populations and WntA KO patterning area. The yellow and green outlines show the WntA KO area as present in at least 50% of the KO samples. (Online version in colour.)

