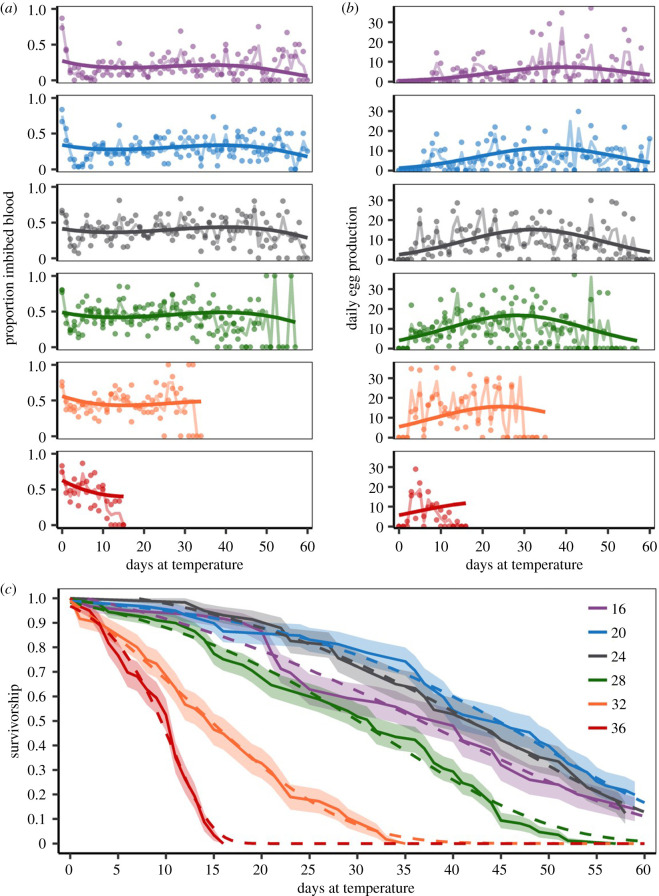
Figure 1.
Temporal effects. Anopheles stephensi life history daily values at 16°C (purple), 20°C (blue), 24°C (grey), 28°C (green), 32°C (orange) and 36°C (red) for the (a) proportion of females that imbibed blood, (b) daily egg production and (c) survivorship. In (a) and (b), dots represent mean trait values for each replicate, with GLMM model predictions (solid line) and the trend across daily means (faded solid line) shown. In (c), Kaplan–Meier estimates (solid line, 95% CI: shaded area) and the best-fitting survival distribution (Gompertz; dashed line) are shown. (Online version in colour.)

