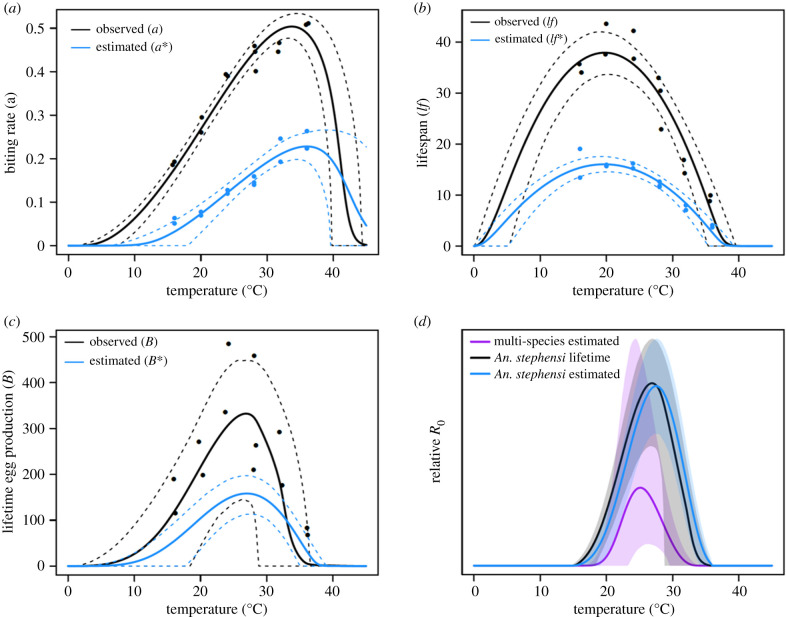
Figure 2.
Comparison of lifetime and estimated traits. Comparison of temperature–trait relationships between observed lifetime trait values (black) and estimated lifetime values (blue) for (a) biting rate (a), (b) lifespan (lf) and (c) lifetime egg production (B). No data points (dots) are displayed for B* in (c), because this trait is the product of EFD*(T) and lf*(T). (d) Comparison of the three relative R0(T) models. Each model is plotted relative to the respective max upper 95% CI value with mean model values (solid line) and CI (faded area) across temperature. (Online version in colour.)

