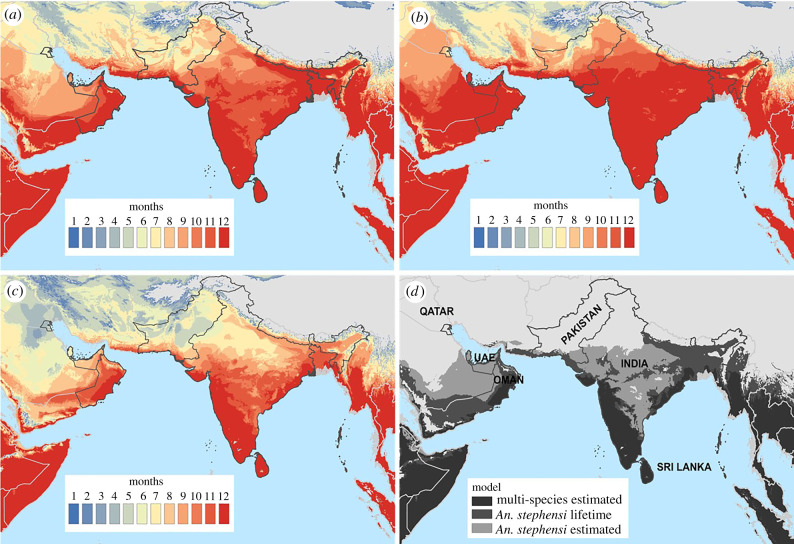
Figure 3.
Mapping thermal suitability. Number of months with relative R0(T) > 0 for (a) An. stephensi lifetime, (b) An. stephensi estimated and (c) multi-species estimated traits. (d) Mapping overlay of all models with year-round thermal suitability (deep red shading in previous panels) with An. stephensi estimated (bottom layer, light grey), An. stephensi lifetime (middle layer, dark grey) and multi-species estimated (top layer, black). Thus, the black region corresponds to the areas where all three models predict year-round thermal suitability, the dark grey reflects the additional area predicted by the An. stephensi models, while the light grey represents the additional area predicted for the An. stephensi estimated model only. (Online version in colour.)

