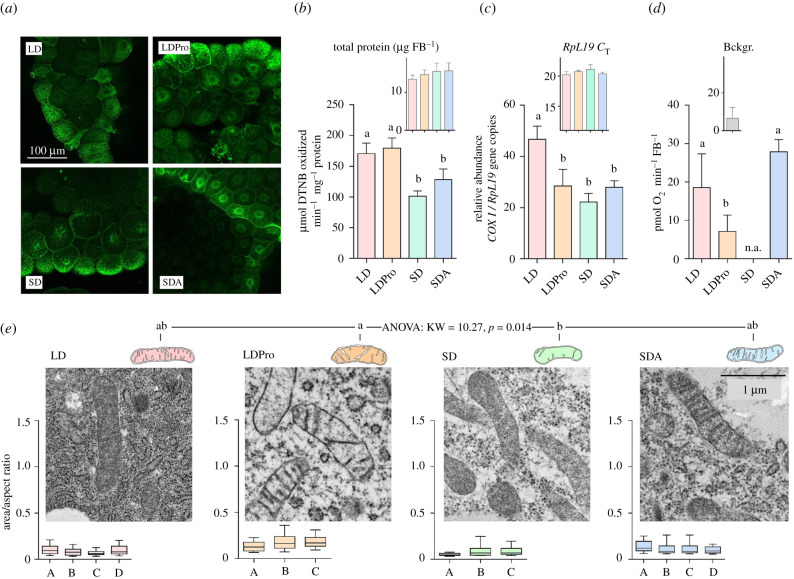
Figure 2.
The effect of acclimation protocols on C. costata larval fat body mitochondrial counts, shape and function. (a) Example micrographs of fat body tissues dissected from four phenotypic variants differing in freeze tolerance (LD, LDPro, SD and SDA, see §2a and figure 1 for explanations). The tissues were stained using MitoTracker Green (see the electronic supplementary material, figure S1 for more details on staining and microscopy procedures). (b) Citrate synthase (CS) activity in fat body tissues of four freeze tolerance phenotypes. Each column is a mean and s.d. of four biological replicates of CS activity assay (each containing 50 dissected tissues pooled). (c) Ratio of mitochondrial/nuclear (mt nu−1) DNA in larval fat body for four freeze tolerance phenotypes. Each column is a mean and s.d. of four biological replicates (each containing 50 dissected tissues pooled) of the RT-qPCR relative quantitation of mitochondrial (COXI) and nuclear (RpL19) gene copies. (d) Oxygen consumption analysed using the PreSens system (see the electronic supplementary material, figure S3 for details) in larval fat body for three freeze tolerance phenotypes (n.a., SD tissues were not assessed). Each column is a mean and s.d. (after the background (Bckgr.) reading has been subtracted) of four to eight biological replicates (each containing 20 dissected tissues pooled). The differences between phenotypes in (b–d) were assessed by ANOVA followed by Tukey's multiple comparisons test (statistically different variants are flanked by different letters). (e) Representative TEM micrographs of fat body mitochondria in the four phenotypes. All micrographs were taken at 25 000 × magnification. Mitochondrial shape was analysed as explained in the electronic supplementary material, figure S2 and the raw dataset of all mitochondrial parameters can be found in the electronic supplementary material, Dataset S1. The box plots below each micrograph show distributions (median, quartiles, 5% and 95% percentiles) of mitochondrial shapes in individual larvae (A–D). The distributions did not pass D'Agostino & Pearson omnibus normality tests, and therefore, the differences in mitochondrial shape between acclimation variants were analysed using the nonparametric Kruskal–Wallis test (KW statistic and p-value shown) followed by Dunn's multiple comparisons test (statistically different variants are flanked by different letters). (Online version in colour.)

