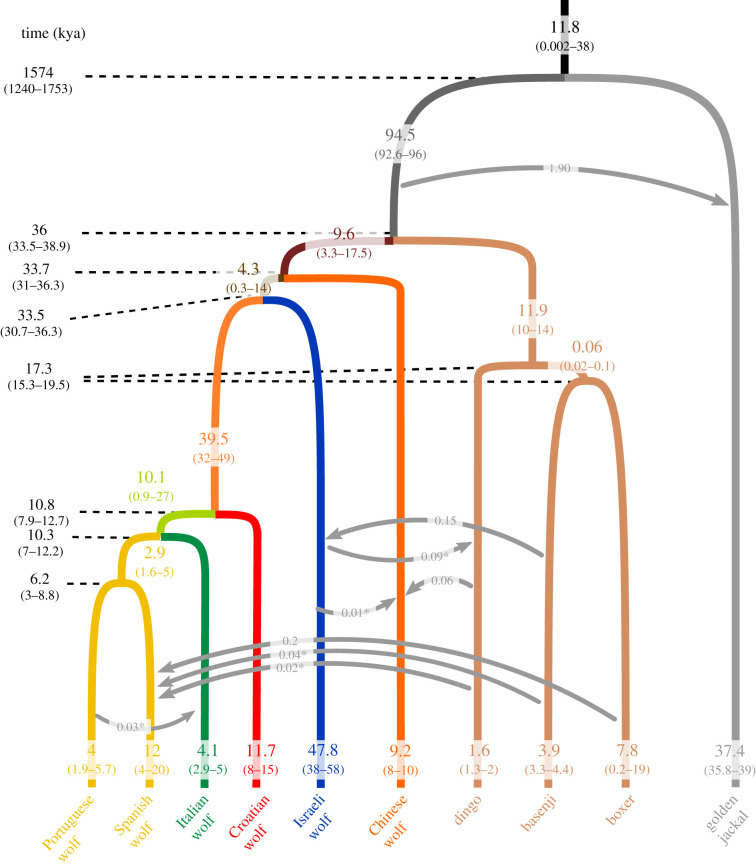
Figure 2.
Demographic model and parameter estimates tested in G-PhoCS. Branch colours of current populations are the same as in figure 1. Values on branches are inferred effective population sizes in thousands of individuals; arrows represent migration; values to the left of the diagram are divergence times in thousands of years. Values were converted using a mutation rate of 4 × 10⁻⁹/bp/generation and a generation time of 4.5 years. For each parameter, mean values and 95% HPDI are shown. Migration rates (on the arrows) with an asterisk are estimates whose 95% HPDI include 0. (Online version in colour.)

