
Figure 1. Hepatocyte-specific PKCλ/ι Ablation Promotes Hepatocarcinogenesis.
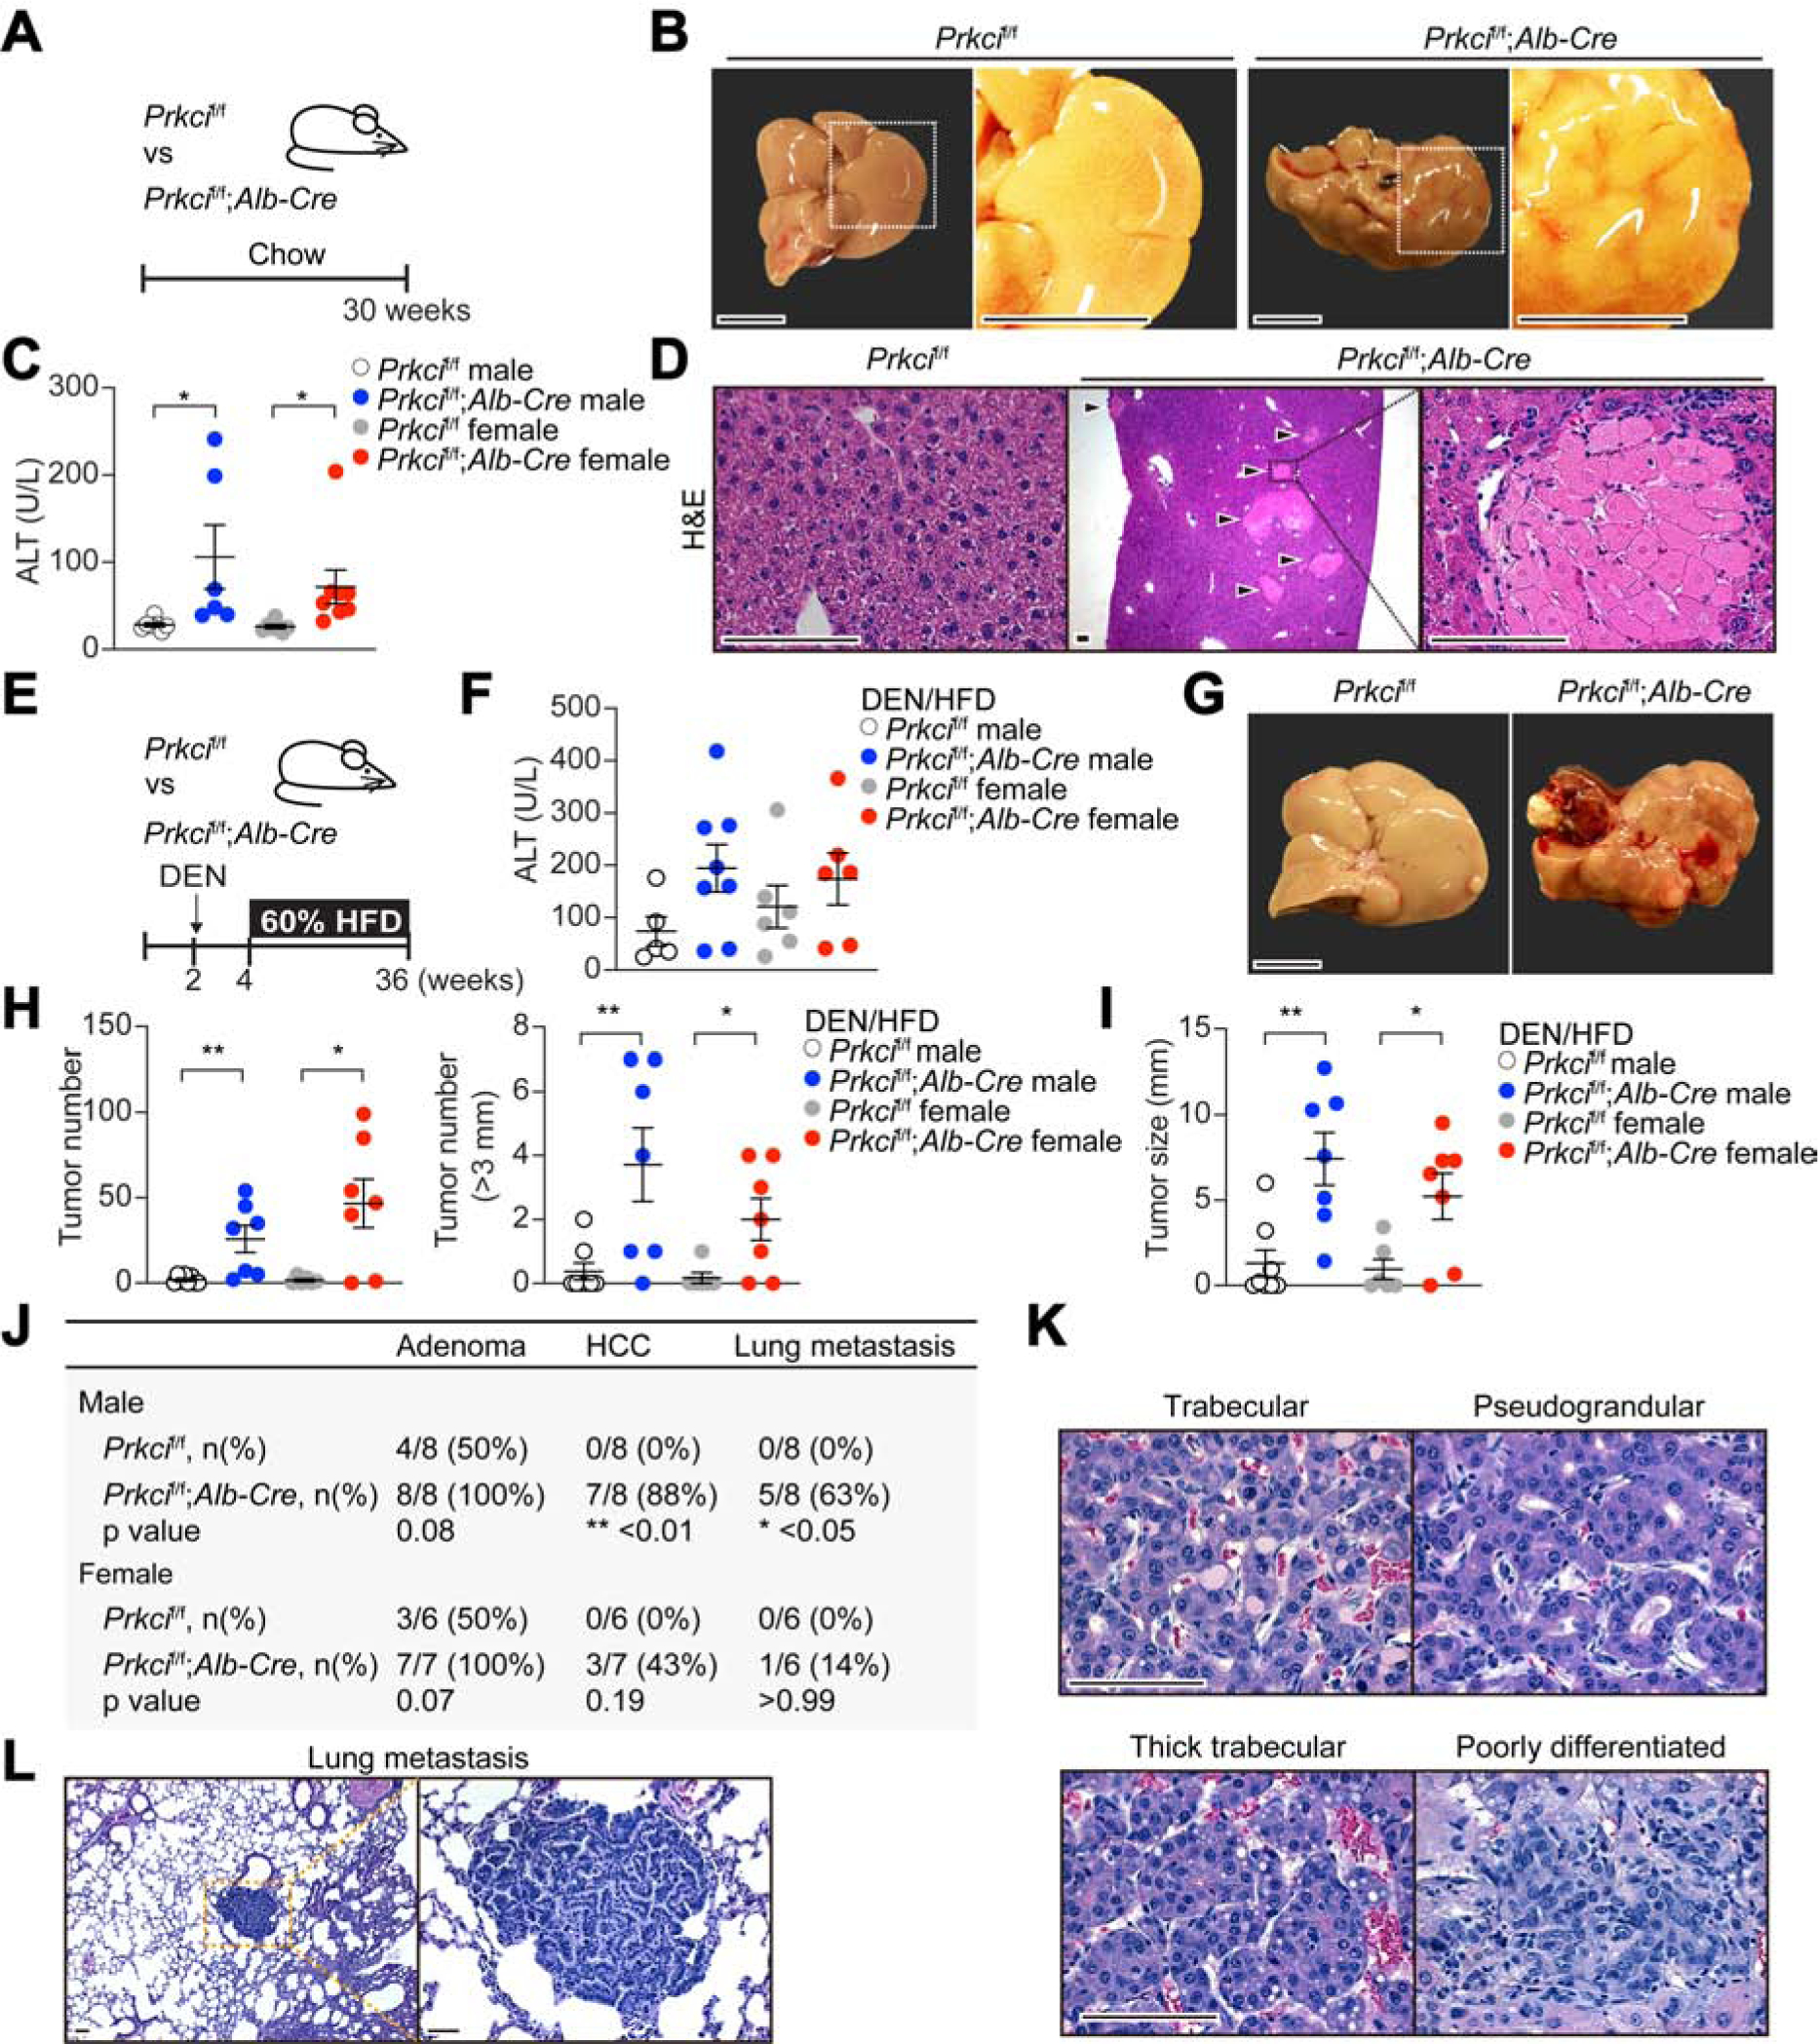
(A) Schematic representation of Prkcif/f;Alb-Cre mice examination.
(B) Images of livers from Prkcif/f and Prkcif/f;Alb-Cre mice. Scale bar, 1 cm.
(C) Serum ALT levels in Prkcif/f (n = 7 males and 6 females) and Prkcif/f;Alb-Cre mice (n = 7 males and 8 females).
(D) H&E staining of Prkcif/f and Prkcif/f;Alb-Cre livers. Arrow heads indicate necrotic foci. Scale bar, 100 μm.
(E) Schematic representation of DEN/HFD-induced HCC model.
(F) Serum ALT levels in Prkcif/f (n = 5 males and 8 females) and Prkcif/f;Alb-Cre (n = 6 males and 6 females) mice treated as in (E).
(G) Images of livers from Prkcif/f and Prkcif/f;Alb-Cre mice treated as in (E). Scale bar, 1 cm.
(H and I) Tumor incidence (H), and maximal tumor diameters (I) in Prkcif/f (n = 8 males and 7 females) and Prkcif/f;Alb-Cre (n = 6 males and 7 females) livers.
(J) Frequencies of liver adenoma, HCC and lung metastasis in Prkcif/f and Prkcif/f;Alb-Cre mice.
(K and L) H&E staining of tumor sections from Prkcif/f;Alb-Cre livers showing different tumor histological grades (K), and lung metastasis (L) from Prkcif/f;Alb-Cre animals. Scale bar, 100 μm.
Mean ± SEM. *p < 0.05, **p < 0.01. See also Figures S1 and S2.