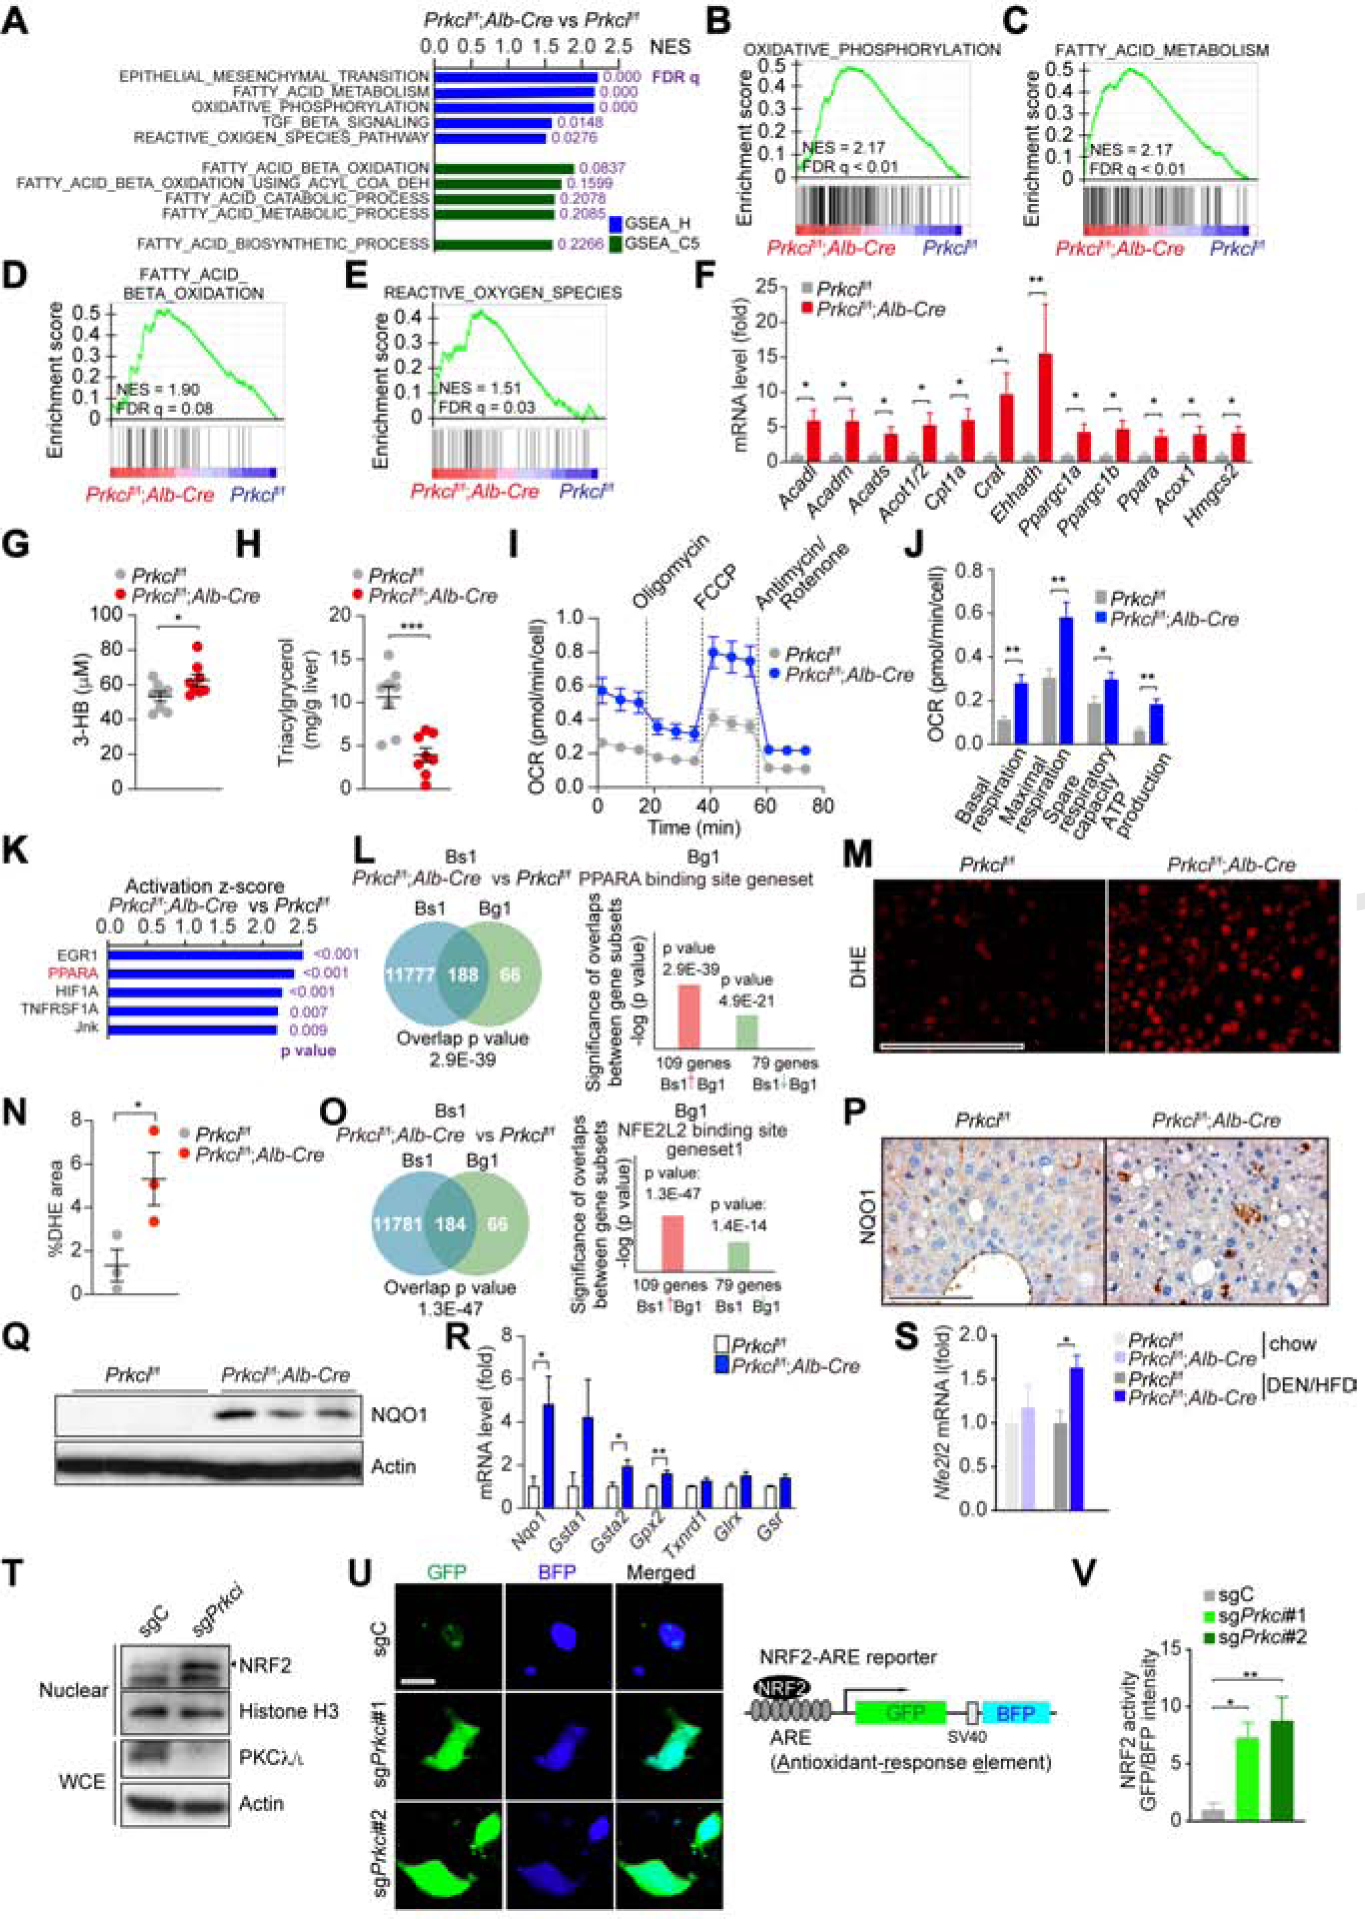
Figure 2. Selective PKCλ/ι Deficiency in Hepatocytes Results in Metabolic Reprogramming.

(A) Top 5 GSEA results of Prkcif/f;Alb-Cre vs Prkcif/f livers (n = 3) using compilation H and C5 (MSigDb).
(B-E) GSEA of the indicated genesets.
(F) qPCR of FAO/OXPHOS-related genes in Prkcif/f (n = 6) and Prkcif/f;Alb-Cre (n = 8) livers.
(G and H) Plasma ketone body (G) and hepatic triacylglycerol (H) in Prkcif/f and Prkcif/f;Alb-Cre mice (n = 8) after 12 h fasting followed by 2 h of refeeding.
(I and J) OCR in primary hepatocytes isolated from Prkcif/f and Prkcif/f;Alb-Cre mice (n = 5).
(K) Upstream Regulator Analysis by IPA in Prkcif/f;Alb-Cre livers vs Prkcif/f livers (n = 3).
(L) NextBio analysis of gene overlap between genes upregulated in Prkcif/f;Alb-Cre livers vs Prkcif/f livers (n = 3, Bioset1, Bs1) and PPARα binding gene set (Biogroup 1, Bg1).
(M and N) Images of DHE assay in Prkcif/f and Prkcif/f;Alb-Cre livers (M) and positive area quantification (N) (n = 4). Scale bar, 100 μm.
(O) NextBio analysis of gene overlap between genes upregulated in Prkcif/f;Alb-Cre livers vs Prkcif/f livers (n = 3, Bioset1, Bs1) and NRF2 binding gene set (Biogroup 1, Bg1).
(P and Q) NQO1 IHC (P) and immunoblot (Q) in Prkcif/f and Prkcif/f;Alb-Cre livers. Scale bar, 100 μm.
(R) qPCR of NRF2 target genes in Prkcif/f (n = 6) and Prkcif/f;Alb-Cre (n = 8) livers.
(S) Nfe2l2 expression levels (RNA-seq, FPKM) in Prkcif/f (n = 3 for chow diet and DEN/HFD) and Prkcif/f;Alb-Cre (n = 3 and n = 4 for chow and DEN/HFD, respectively) livers.
(T) Immunoblots of indicated proteins in sgPrkci or sgC cells.
(U and V) IF images left) and design of the NRF2 reporter (right) (U). Scale bar, 10 μm. Quantification of NRF2 activity (n > 10 cells) (V).
Mean ± SEM. *p < 0.05, **p < 0.01, ***p < 0.001. See also Figure S3.
