
Figure 3. Loss of PKCλ/ι in Hepatocytes Enhances Oxidative Phosphorylation.
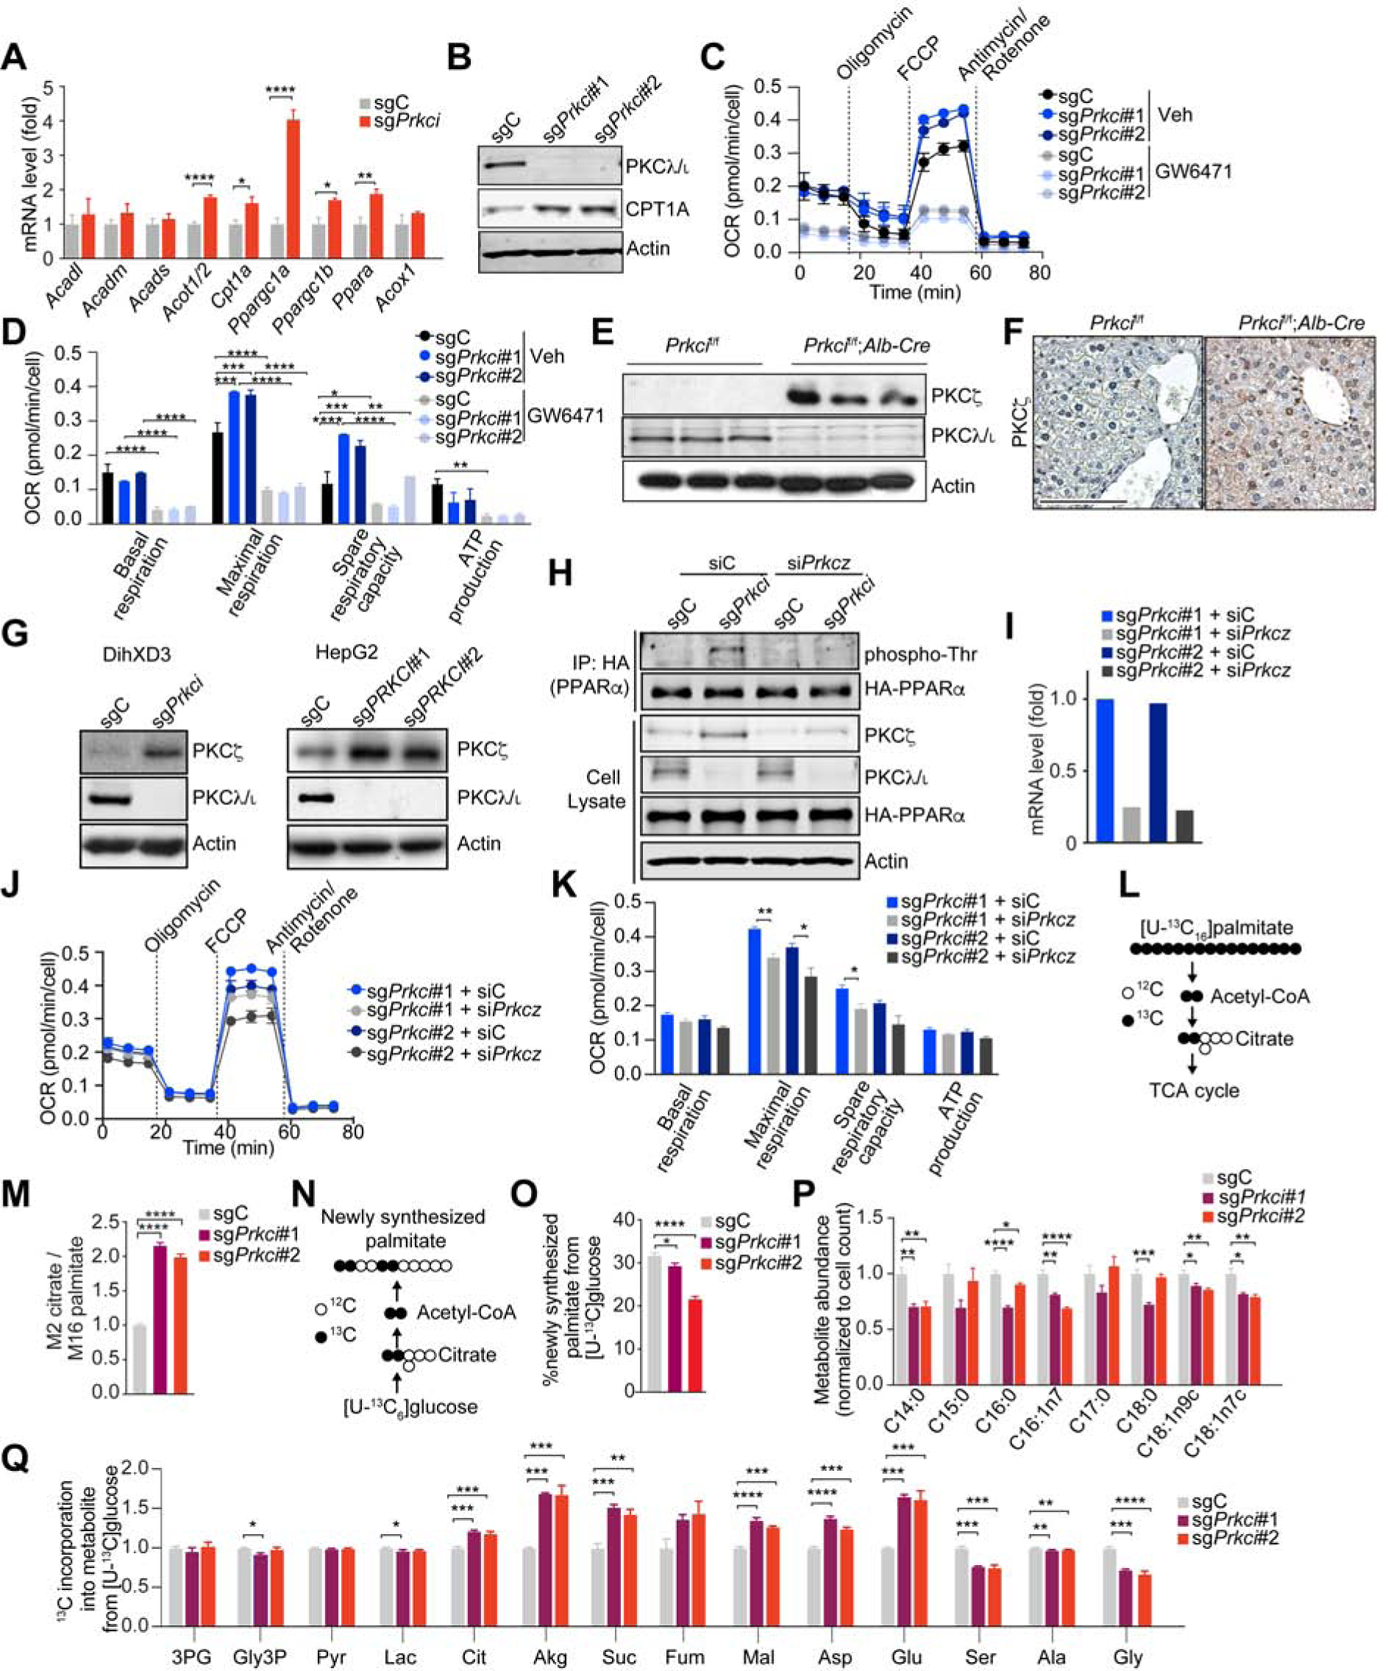
(A) qPCR of FAO/OXPHOS-related genes in sgPrkci (n=6) or sgC (n = 5) cells.
(B) Immunoblot of indicated proteins in sgPrkci (#1 and #2) or sgC cells.
(C and D) OCR measurement in sgPrkci (#1 and #2) and sgC cells (n = 3 – 5) treated with GW6471 (10 μM) or DMSO (Veh) for 24 h.
(E) Immunoblots of indicated proteins in Prkcif/f and Prkcif/f;Alb-Cre livers from 30-week-old mice (n = 3).
(F) IHC for PKCζ in Prkcif/f and Prkcif/f;Alb-Cre livers.
(G) Immunoblot of PKCζ in sgPrkci or sgC DihXD3 and HepG2 cells.
(H) Immunoprecipitation of HA-tagged human PPARα in BNL CL.2 cells treated with Calyculin A (100 nM, 2 h) and immunoblot for the indicated proteins.
followed by immunoblot of phospho-Threonine.
(I) qPCR of Prkcz in the indicated cells lines.
(J and K) OCR measurement in cell lines form (I) (n = 3).
(L) Schematic depicting 13C carbon labeling on citrate from [U-13C]palmitate via fatty acid oxidation.
(M) Fatty acid oxidation over 6 h depicted as M2 labeling on citrate relative to M16 labeling on intracellular palmitate from [U-13C16]palmitate trace in sgPrkci (#1 and #2) and sgC cells (n = 3).
(N) Schematic depicting 13C carbon labeling on palmitate from [U-13C]glucose via de novo lipogenesis.
(O) Percent of newly synthesized palmitate from [U-13C6]glucose over 24 h in sgPrkci (#1 and #2) and sgC cells (n = 3).
(P) Intracellular metabolite abundance in sgPrkci (#1 and #2) BNL CL.2 cells relative to control (sgC) (n = 3)
(Q) 13C incorporation into intracellular metabolites from [U-13C6]glucose over 24h in sgPrkci (#1 and #2) and sgC cells (n = 3).
Mean ± SEM with exception of (H), in which mean ± 95% confidence interval. *p < 0.05, **p < 0.01, ***p < 0.001, ****p < 0.0001. See also Figure S4.