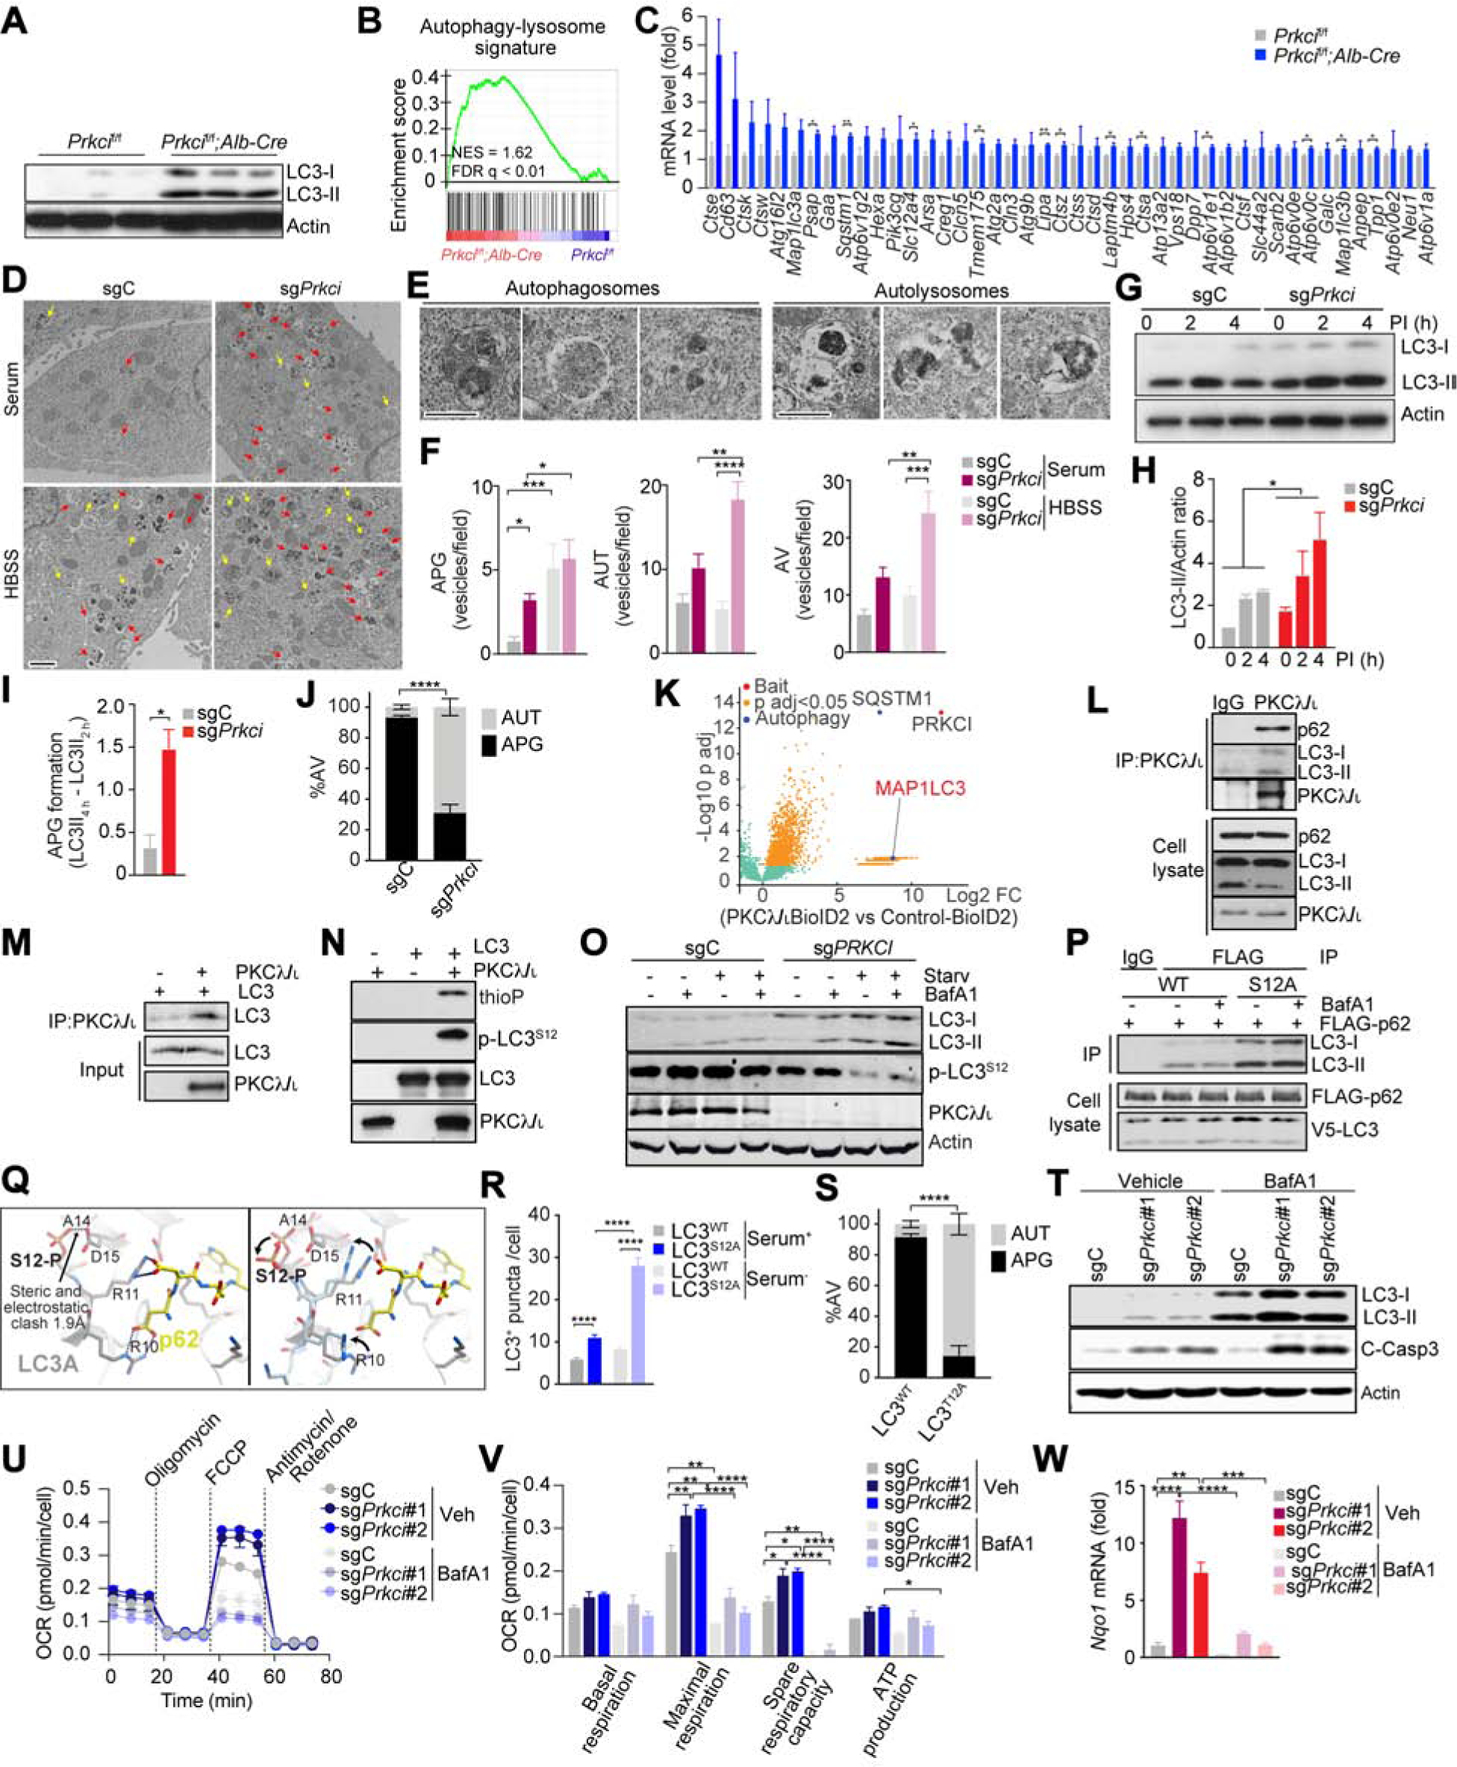
Figure 4. PKCλ/ι deficiency in hepatocytes Enhances Autophagy Flux.

(A) Immunoblot for LC3 and actin in Prkcif/f and Prkcif/f;Alb-Cre livers (n = 3).
(B and C) GSEA of the autophagy associated geneset in Prkcif/f;Alb-Cre livers vs Prkcif/f livers (n = 3) (B), and expression of core genes in the signature (FPKM) (C).
(D) EM images of sgPrkci and sgC cells in serum supplemented media (Serum) or HBSS. Arrows: autophagosomes (yellow) and autolysosomes (red). Scale bar, 1 μm.
(E-F) Images of autophagosomes (APG) and autolysosomes (AUT) (E), and quantification of APG, AUT and autophagic vacuoles (AV) (F). Scale bar, 0.5 μm.
(G-H) Immunoblot for LC3 in response to lysosomal inhibitors (PI) (G) and quantification of LC3-II intensity normalized to actin (n = 3) (H), in sgPrkci and sgC cells cultured in FBS-free media.
(I) Calculated speed of autophagosome formation (n = 3).
(J) Quantification of APG and AUT in sgPrkci and sgC cells in response to 4 h of FBS starvation using tandem fluorescent-tagged LC3B reporter plasmid (n > 20 cells).
(K) Volcano plot of biotinylated proteins in PKCλ/ι-BioID2 vs Empty-BioID2 HEK239T cells.
(L) Immunoprecipitation for endogenous PKCλ/ι followed by immunoblot for indicated endogenous proteins in HEK293T cells.
(M) Interaction between recombinant human PKCλ/ι and human LC3.
(N) In vitro kinase assay. Phosphorylated LC3 detection by immunoblot for thiophosphate ester (thioP) and phosphorylated Ser 12 in LC3 (p-LC3S12).
(O) Immunoblot of indicated proteins in sgC and sgPRKCI HEK293T cells in response to control (DMSO), bafilomycin A1 (BafA1, 100 nM), FBS and amino acid-depletion (Starv), and BafA1 and Starv treatment for 48 h.
(P) Immunoblot of cell lysate and FLAG-tagged immunoprecipitates of HEK293T cells transfected with FLAG-tagged p62 and V5-tagged LC3 in response to BafA1 (200 nM) treatment for 12 h.
(Q) Molecular structure of human LC3.
(R) Quantification of LC3 positive puncta in LC3 wild-type (WT) or S12A mutant (S12A) BNL CL.2 cells (n > 20 cells) cultured with or without serum for 4 h.
(S) Quantification of AUT in BNL CL.2 cells in response to 4 h of FBS starvation using tandem fluorescent-tagged LC3B wild-type (WT) or T12A mutant (T12A) reporter plasmid (n > 20 cells).
(T) Immunoblot for LC3 and cleaved caspase-3 in sgC and sgPrkci cells with or without BafA1 (30 nM).
(U and V) OCR measurement in sgPrkci (#1 and #2) and sgC cells (n = 3) treated with BafA1 (30 nM) or control (Veh).
(W) qPCR for Nqo1 mRNA expression in sgC and sgPrkci cells with or without BafA1 (30 nM) (n = 3).
Mean ± SEM. *p < 0.05, **p < 0.01, ***p < 0.001, ****p < 0.0001. See also Figure S5.
