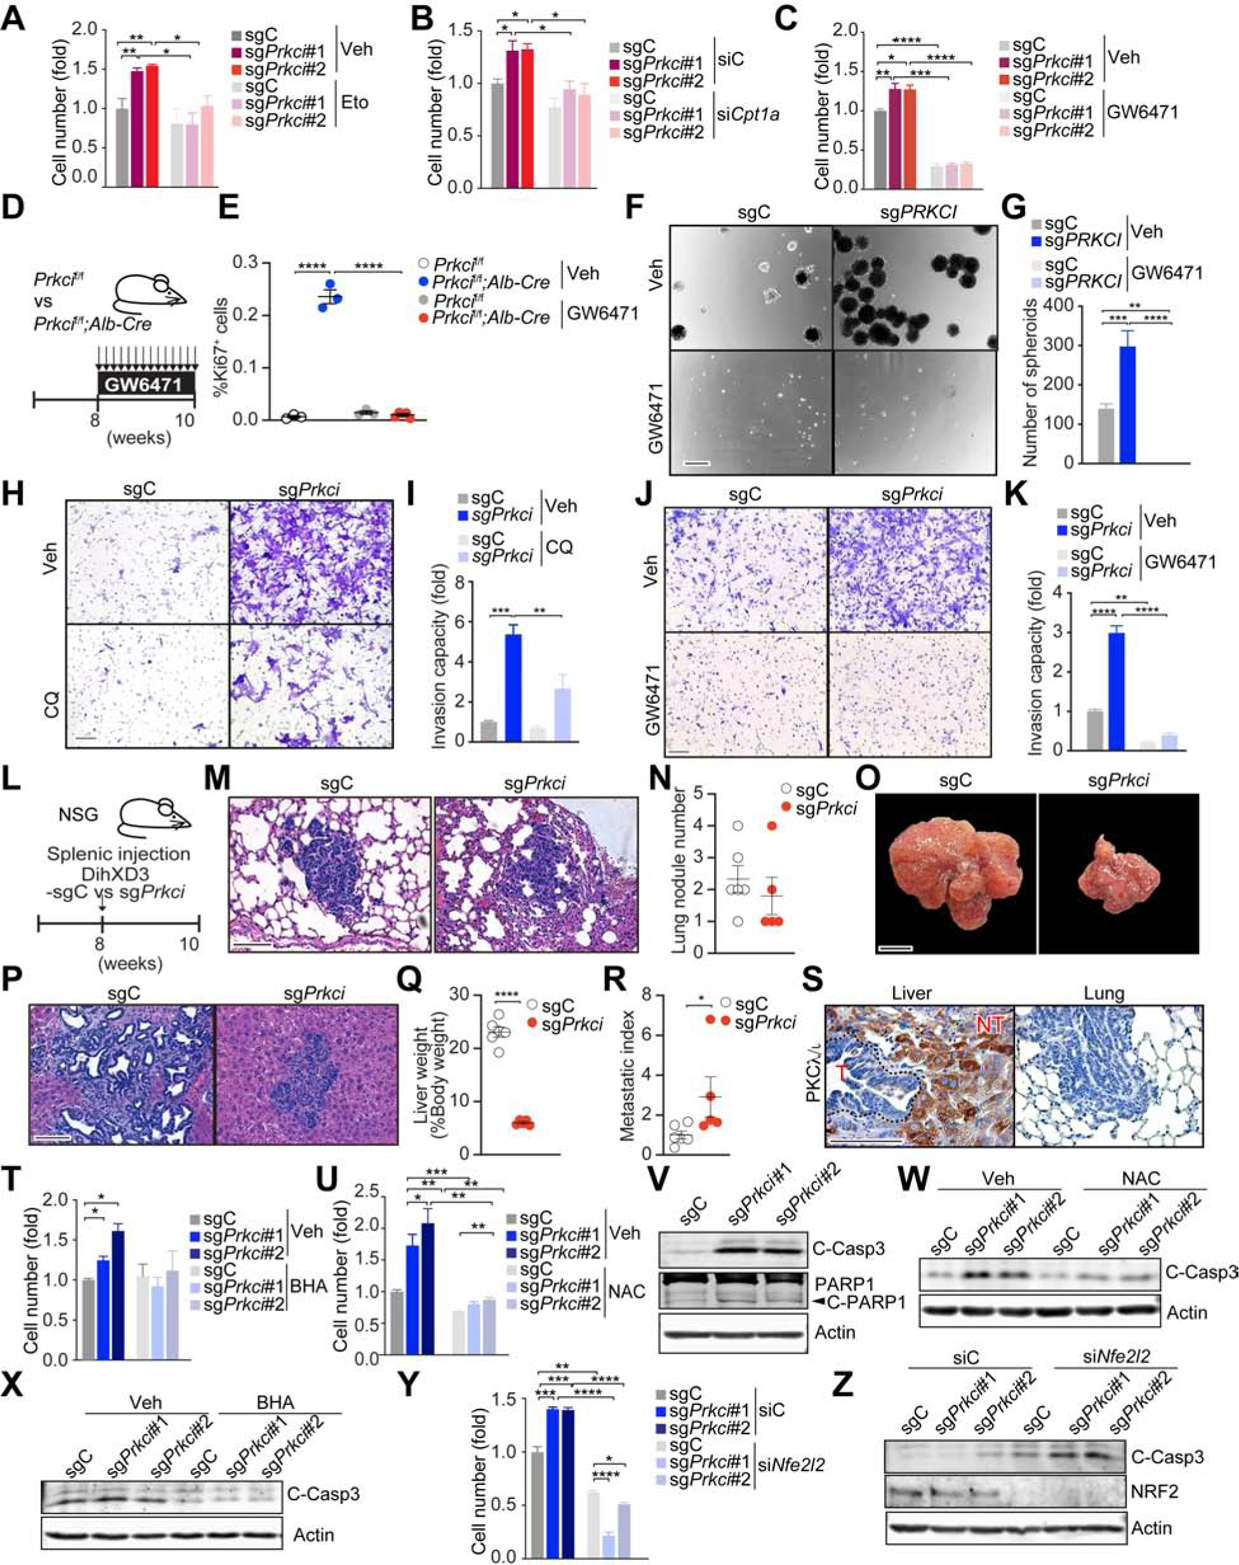
Figure 5. Loss of PKCλ/ι Enhances the Aggressive Phenotype of Hepatoma Cells.

(A) Cell number of sgPrkci or sgC cells treated with etomoxir (Eto, 10 μm) or vehicle control (Veh) for 7 days (n = 3).
(B) Cell number of sgPrkci or sgC cells 7 days after siRNA-induced knockdown of Cpt1a (siCpt1a) or control siRNA (siC) (n = 3).
(C) Cell number of sgPrkci or sgC cells treated with GW6471 (5 μM) or Veh for 6 days (n = 3).
(D) Schematic representation of GW6471 treatment.
(E) Quantification of Ki-67 positive hepatocytes by IHC (n = 3–5) in mice treated as in (D).
(F and G) Sphere formation assay of sgPRKCI or sgC HepG2 cells treated with GW6471 (10 μM) or Veh. Images (F) and quantification of spheres (n = 4) (G).
(H and I) Invasion of sgPrkci or sgC DihXD3 cells treated with chloroquine (CQ, 5 μM) or Veh. Images (H) and quantification of invasive cells (n = 3) (I).
(J and K) Invasion of sgPrkci or sgC DihXD3 cells treated with GW6471 (10 μM) or Veh. Images (J) and quantification of invasive cells (n = 3) (K).
(L) Schematic representation of sgPrkci or sgC DihXD3 cells transplantation through splenic injection in male NSG mice (sgC, n = 6; sgPrkci, n = 5).
(M-N) H&E staining (M) and quantification of lung metastasis (N) in mice treated as in (L).
(O-R) Images (O), H&E staining (P), quantification of liver weight normalized to body weight (Q), and metastatic index (R) of livers from mice treated as in (L).
(S) IHC for PKCλ/ι in hepatic primary tumors and lung metastasis from the animal injected with sgC DihXD3 cells (T, tumor; NT, non-tumor).
(T and U) Cell number of sgPrkci or sgC BNL CL.2 cells treated with butylated hydroxyanisole (BHA, 100 μM) (T) or N-Acetylcysteine (NAC, 2 mM) (U) for 5 days (n = 3).
(V) Immunoblot for cleaved caspase-3 and cleaved PARP1 in sgPrkci or sgC BNL CL.2 cells.
(W and X) Immunoblot for cleaved caspase-3 in sgPrkci or sgC cells treated with NAC (2 mM) (W) or BHA (200 μM) (X) for 72 h.
(Y and Z) Cell number (Y) (n=3), and immunoblot for indicated proteins (Z), 7 days (Y) or 2 (Z) days after knockdown of Nfe2l2 in sgPrkci or sgC cells.
Mean ± SEM. *p < 0.05, **p < 0.01, ***p < 0.001, ****p < 0.0001. Scale bar, 100 μm (F, H, J, M, P and S); 1 cm (O). See also Figure S6.
