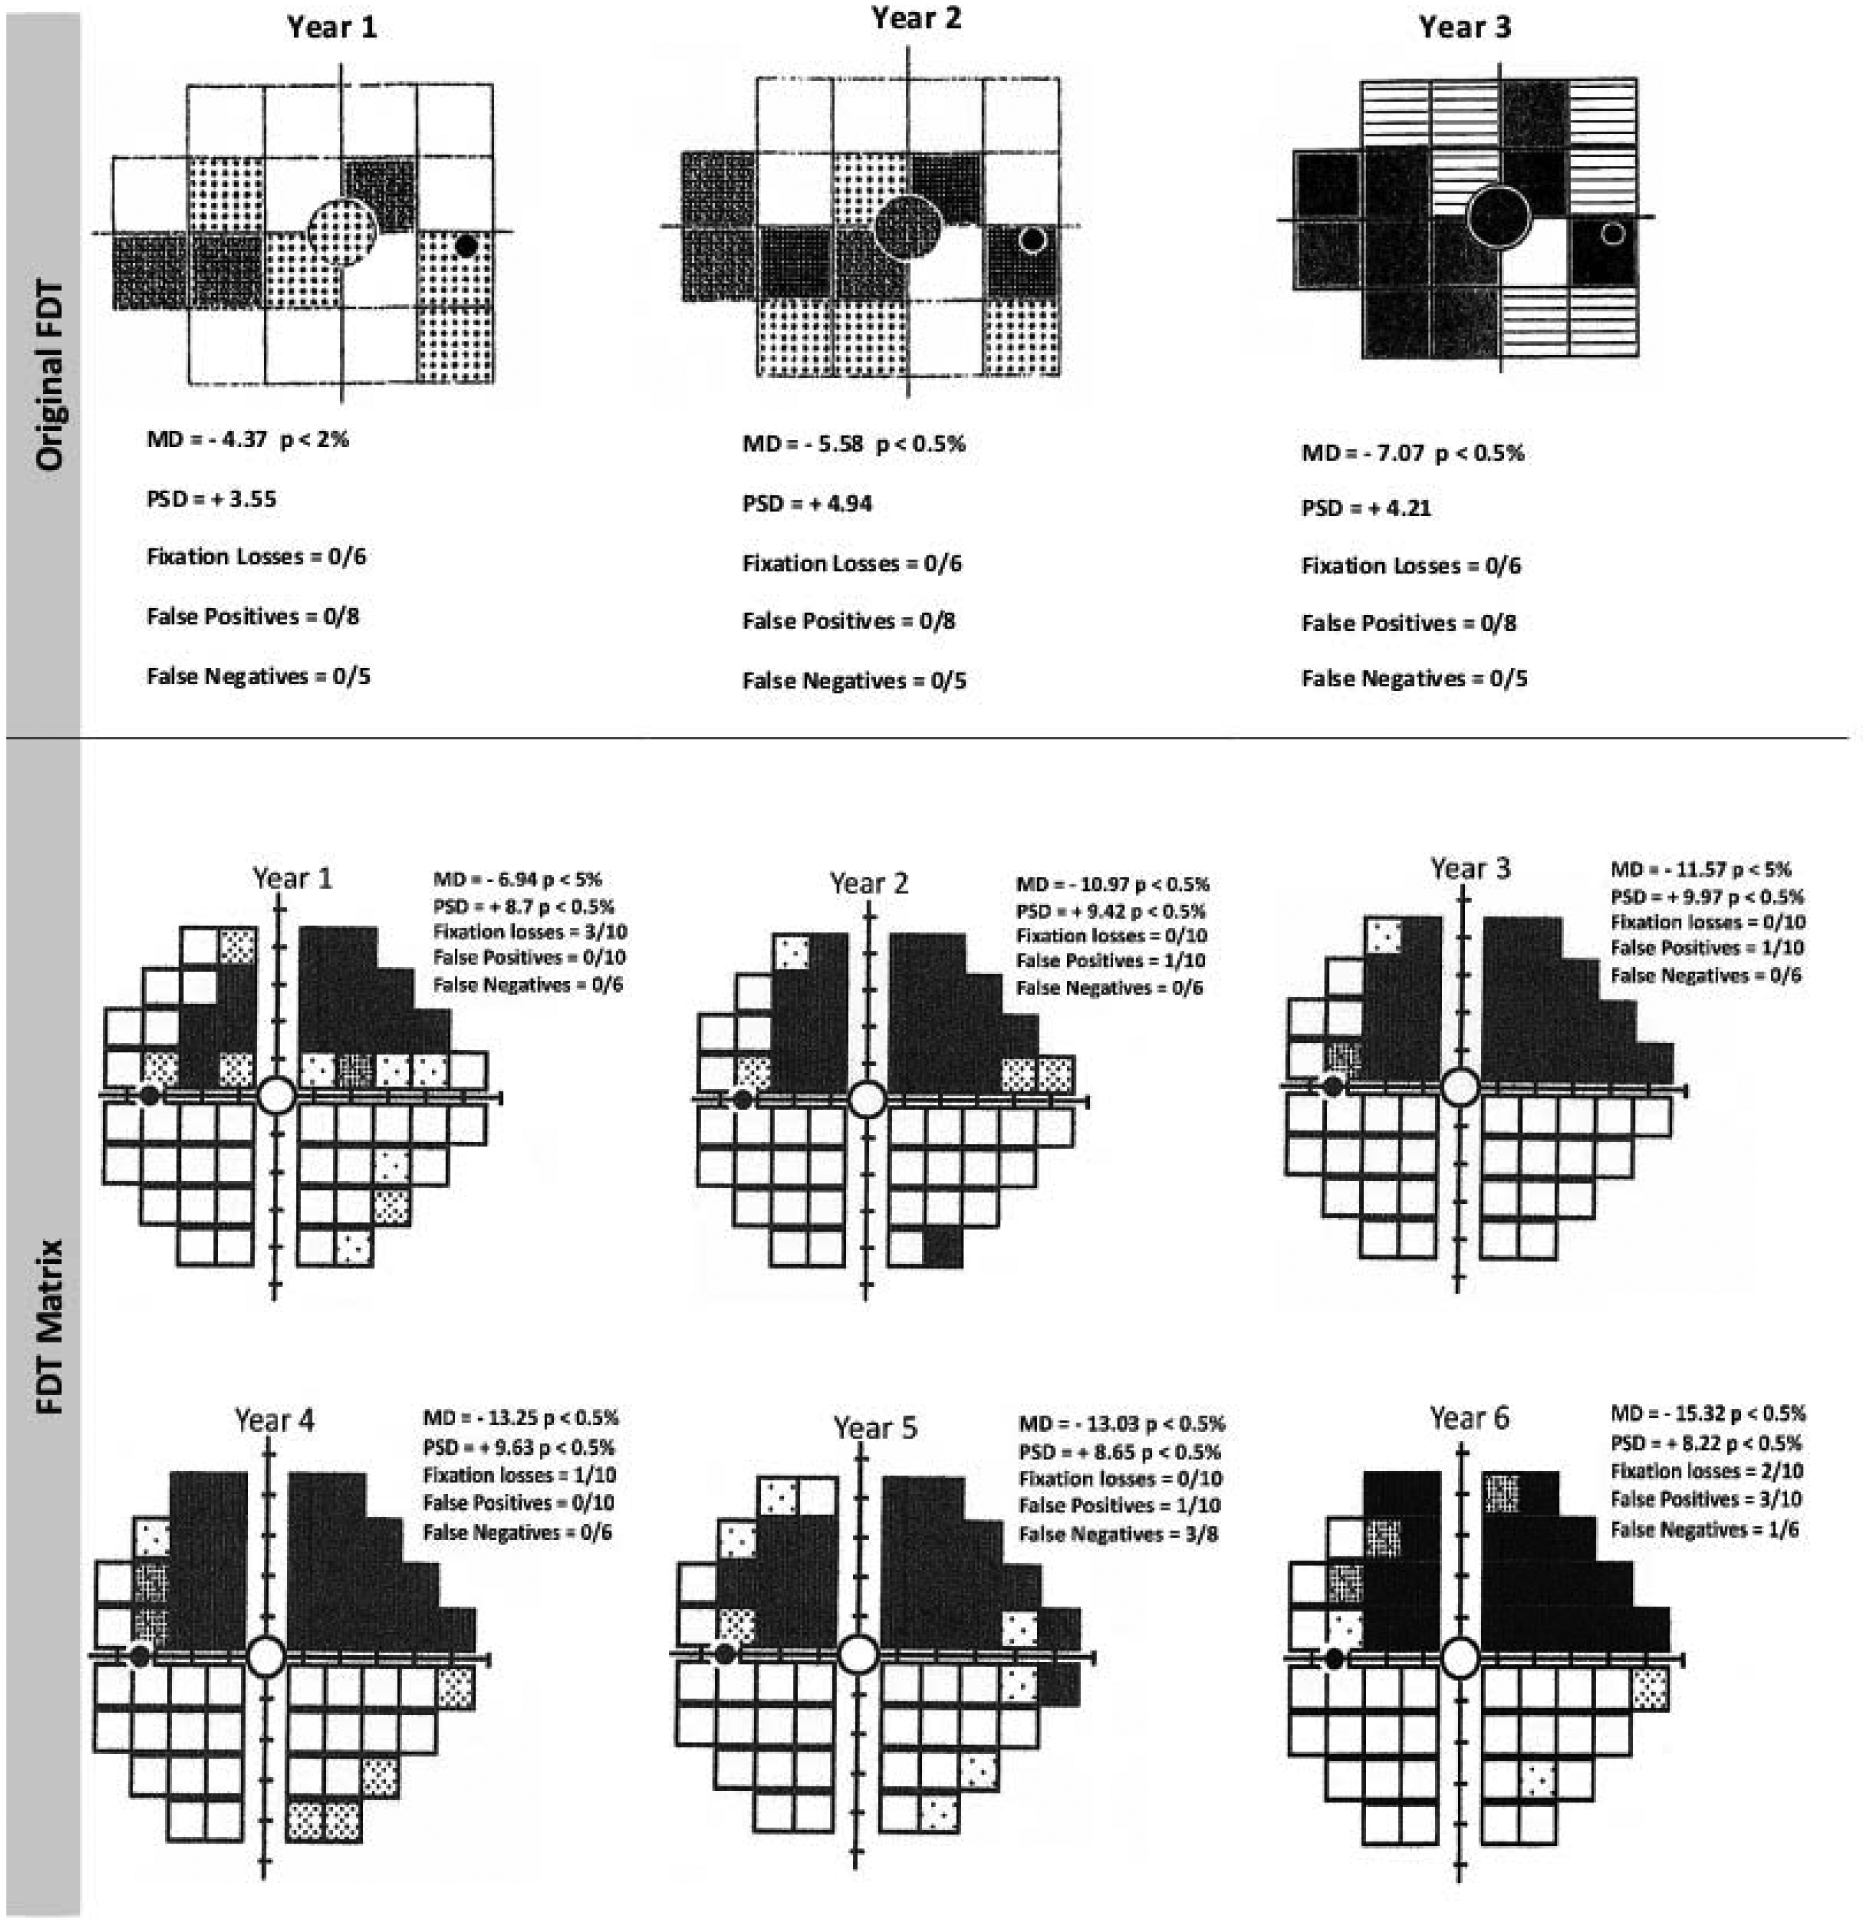
Figure 4.

The longitudinal data for this patient show progression on the original Frequency-Doubling Technology (FDT) Perimetry test for the right eye (upper panel). The pattern deviation plots show an expansion of the scotoma as well as deepening of the defects in several locations. Worsening is also observed on the Mean Deviation (MD) and Pattern Standard Deviation (PSD) across this visual field series. An example of progression of a superior arcuate deficit for the left eye of a glaucoma patient obtained through six years of testing with the 24–2 test pattern on the Humphrey Matrix FDT perimeter. Note that there are also changes in MD and PSD during this time period. FL: Fixation Loss; FP: False Positive; FN: False Negative; MD: Mean Deviation; PSD: Pattern Standard Deviation
