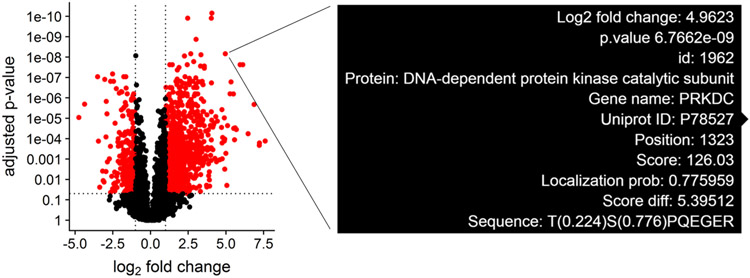
Figure 2: Interactive view of metadata for significantly altered phosphosites.

Phosphosite differential abundance is plotted in a volcano plot for the VAL iCCK1 treatment versus the VAL DMSO control. Hovering over a point renders a text box displaying the protein and gene name, phosphosite position, identification score, localization probability, and flanking amino acid sequence.
