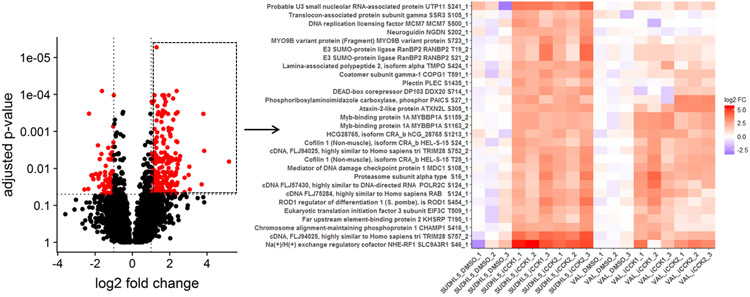
Figure 3: Heatmap of selected phosphosites from Volcano plot.

Selecting multiple points from the volcano plot renders a heatmap of these features, allowing for inspection of within-group variance and comparison of differential abundance across additional groups in the data. Upregulated phosphosites, outlined by a box in the volcano plot, from the SUDHL5 iCCK1 – SUDHL5 DMSO comparison were selected for plotting a heatmap. The heatmap displays the scaled normalized values. The phosphosite effects were strongly similar in SUDHL5_iCCK2. These phosphosites tend to be upregulated in VAL following iCCK treatment, but are not significant and are inhibitor-specific.
