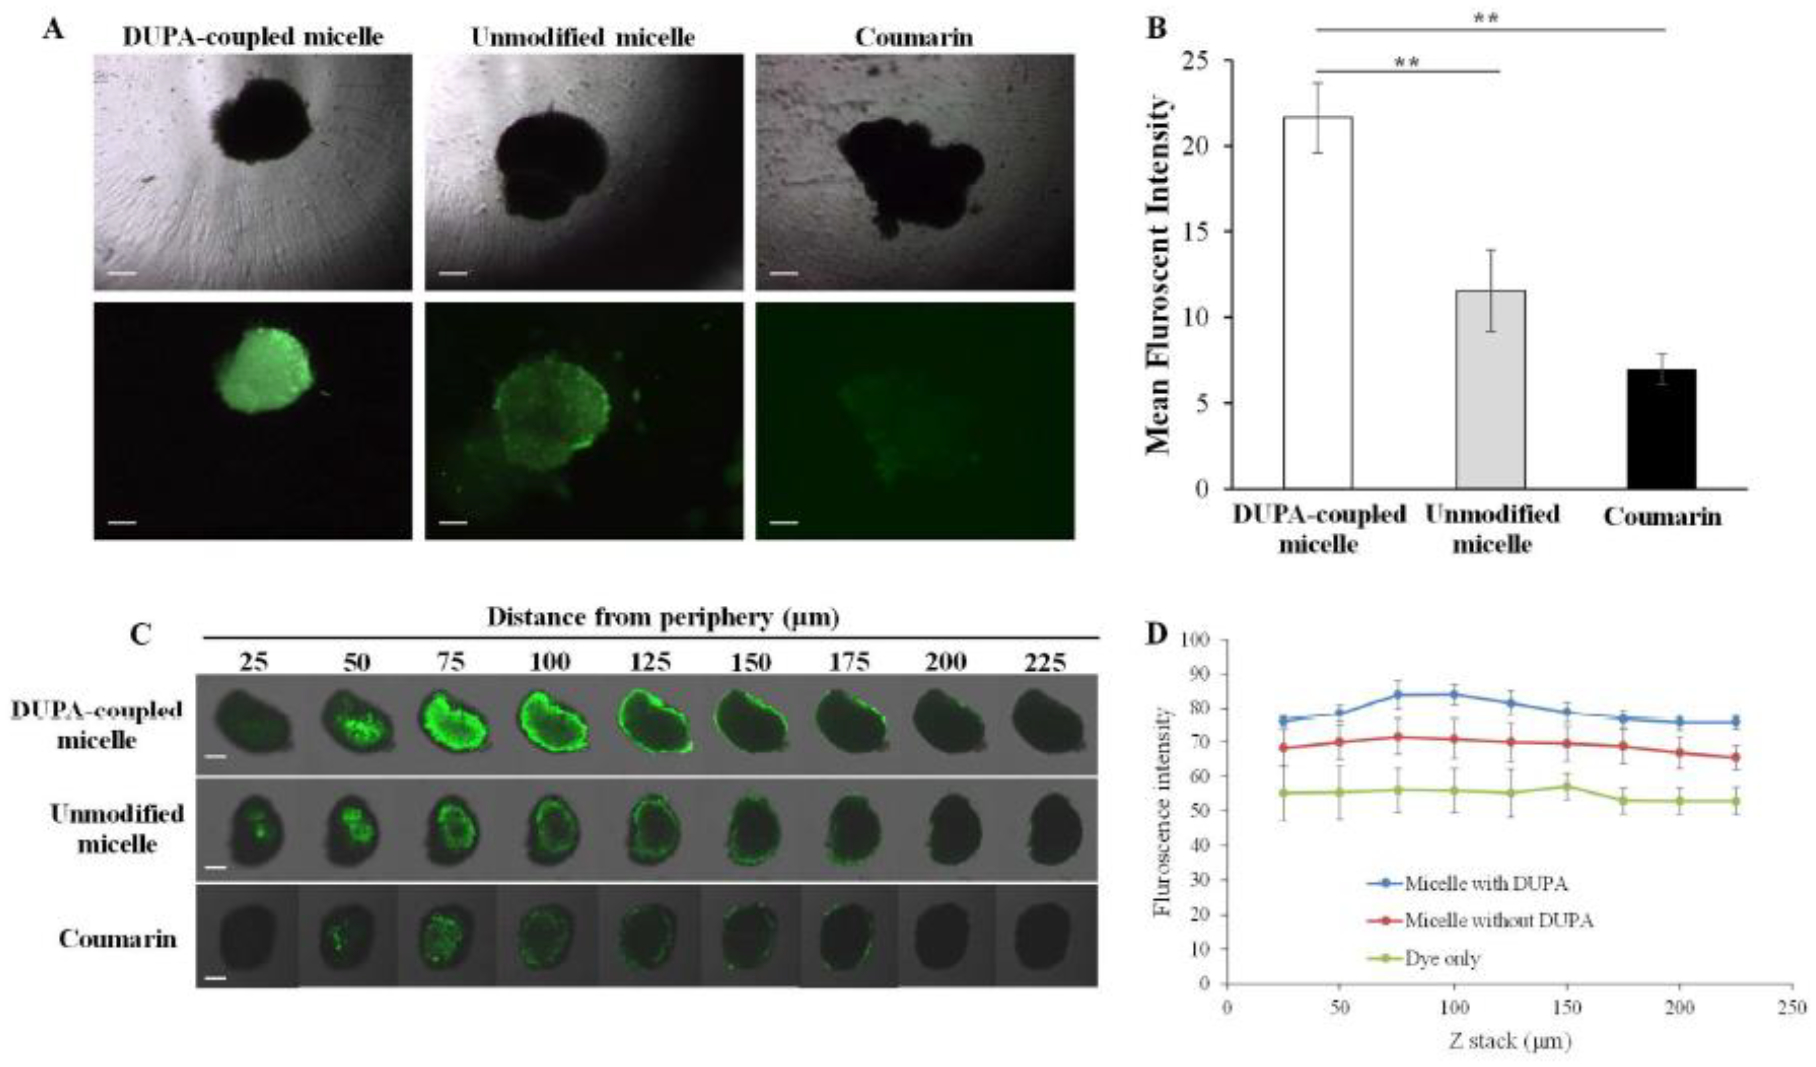
Figure 6. Cellular Uptake and Penetration of the Micelle in 3-D Tumor Spheroids.

(A) Representative fluorescence images of 3-D spheroids incubated with coumarin and coumarin-loaded micelle for 2 h. Scale bar represents 200 μm. (B) Quantitative analysis of the fluorescence intensity of the spheroids. (C) Representative z-stack confocal images of 3-D spheroids incubated with coumarin and coumarin-loaded micelles for 2 h. Scale bar represents 200 μm. (D) Mean fluorescence intensity of the z-stacked confocal images vs. the distance from the periphery of the spheroids. The results are represented as the mean ± SD (n = 3). (**P < 0.01)
