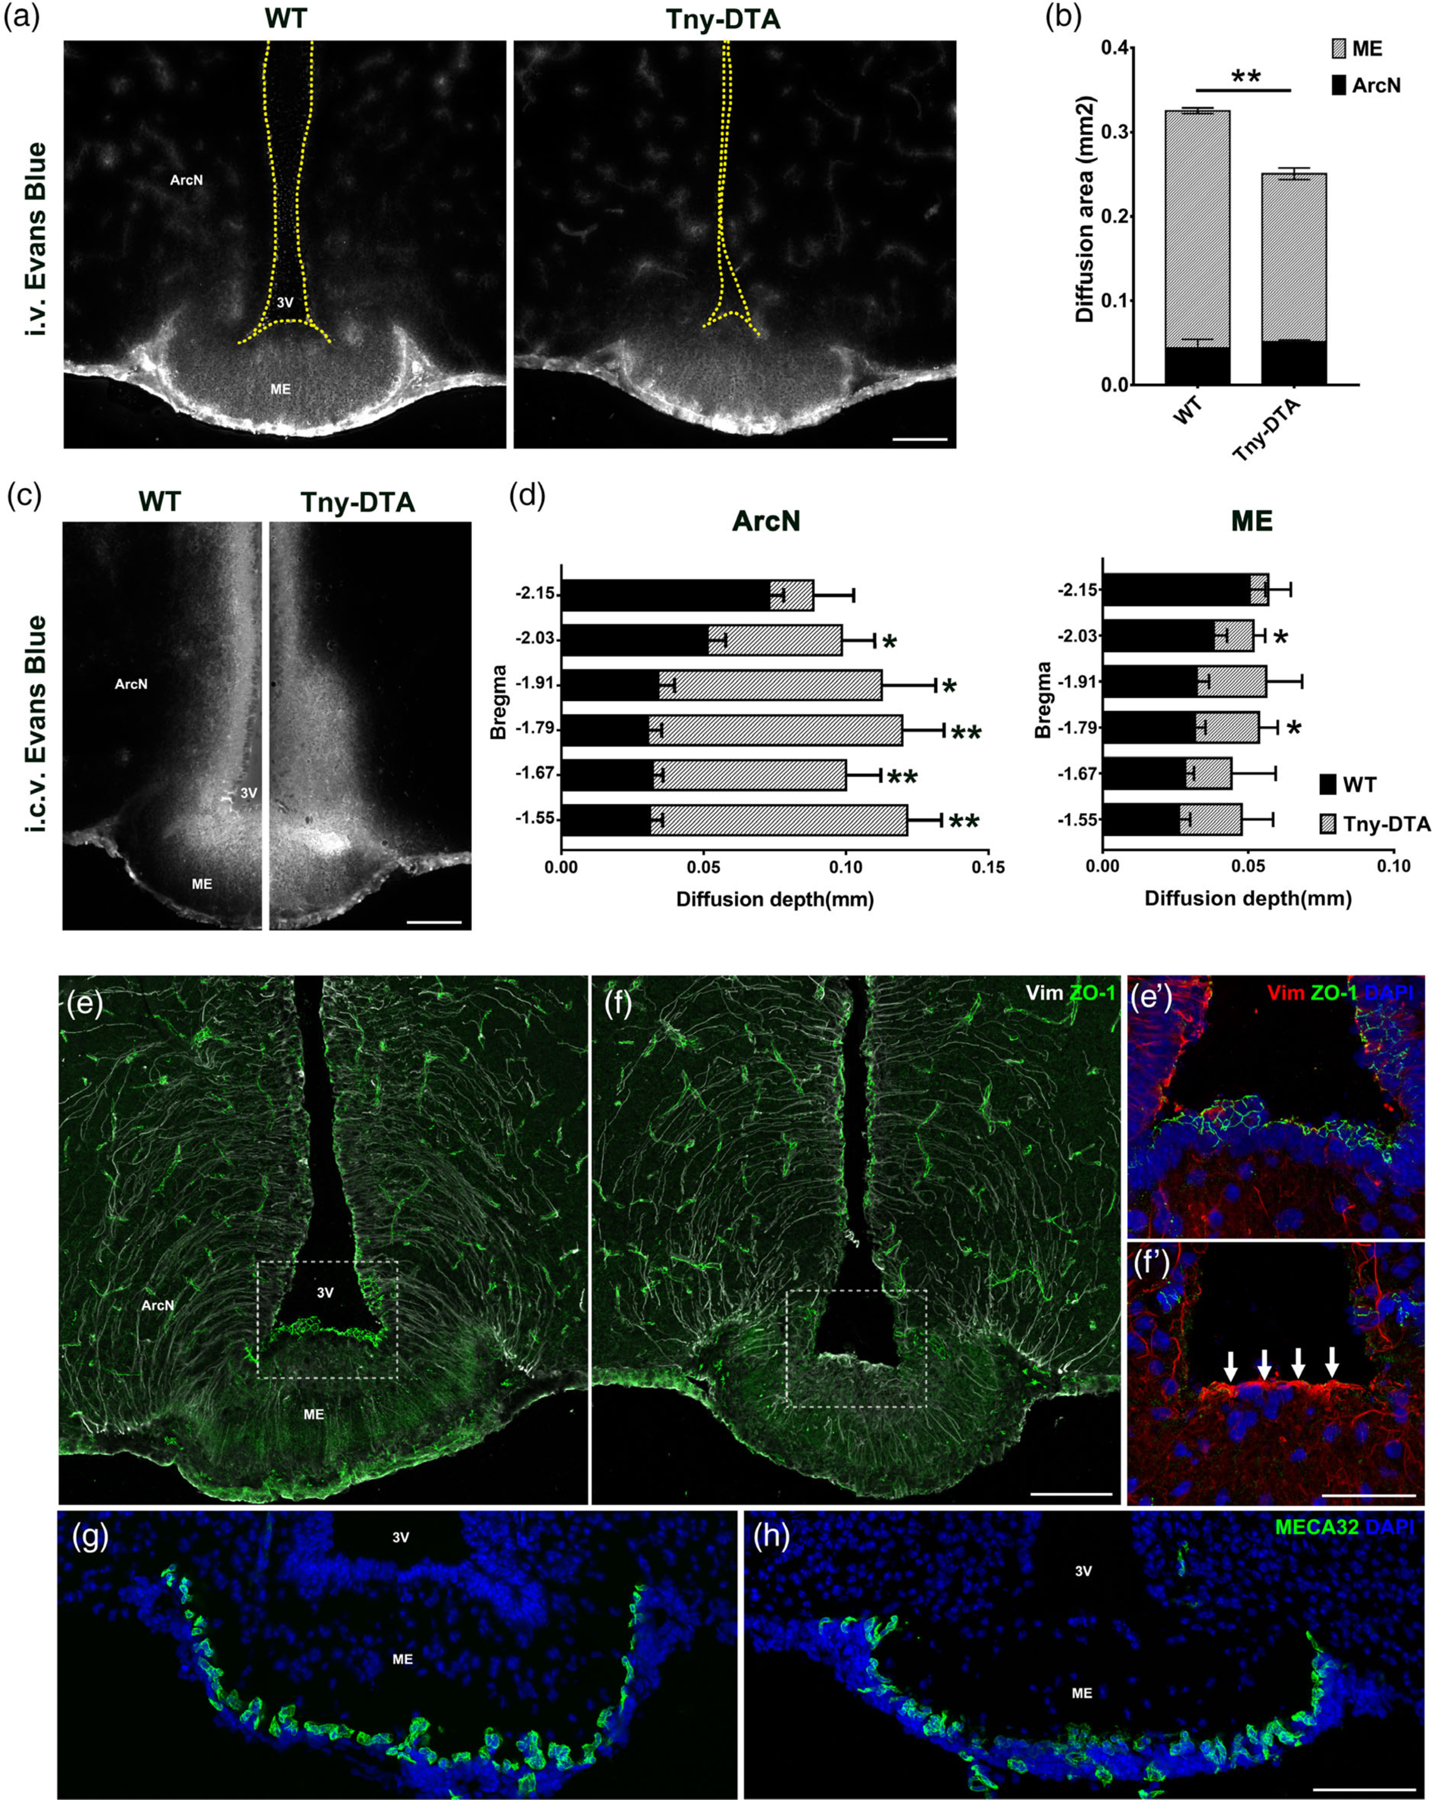
Figure 2.

Ventricular-hypothalamic barriers are disrupted in tanycyte-ablated mouse brain. (a) Representative images of Evans Blue staining in the ventromedial hypothalamus 20 min after i.v. injection. (b) Quantification of the area stained with Evans Blue shown (a), which is mostly restricted to the ArcN and ME. n = 3 per groups. (c) Representative images of Evans Blue staining 5 min after i.c.v. injection. (d) Quantification of the penetration of Evans Blue staining into the ArcN or ME shown (c) in the hypothalamic sections corresponding to the indicated bregma. n = 3 per groups. (e, f) Immunohistochemistry for the tight junction protein ZO-1 (green) and intermediate filament Vimentin (Vim, white). The staining patterns for ZO-1 and Vim were lost following tanycyte ablation. Increased Vim expression (white arrows) in the third ventricular floor reveals a glial scar formation. (e′, f′) are the higher magnification images of the boxed area in (e, f). (g, h) Immunostaining against the fenestrated capillary marker, MECA32 (green). Scale bar: 100 μm (a, c, f, h), 50 μm (f′). *p < .05, **p < .005, two-tailed Student’s t test
